miRTarVis+ is a web-based interactive visual analytics tool for microRNA target predictions.
In this document, I will introduce how to use miRTarVis+ step by step.
miRTarVis+ uses a step-by-step navigation interface. The main menu consists of four submenus, including load data, filter, prediction, and visualization.
Here, I will show you how to use miRTarVis+ with a randomly generated sample miRNA-mRNA expression profile data.
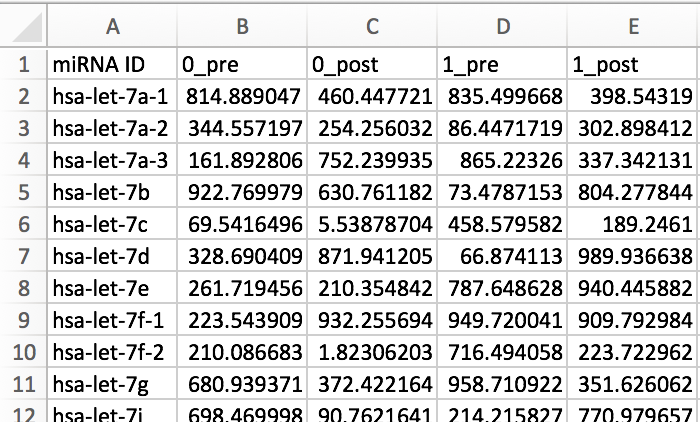
From the research page of miRTarVis+, you can download example data of miRNA and mRNA expression profile data.
They are CSV format files, whose first row contain sample names and first column contain miRBase miRNA IDs for miRNAs or gene symbols for mRNAs. These two files contain expression level for multiple samples of all miRNAs or mRNAs. And for each miRNA or mRNA-sample, they measured twice (treatment vs. control). All values in the example data were randomly generated in the range of 0 ~ 1000.
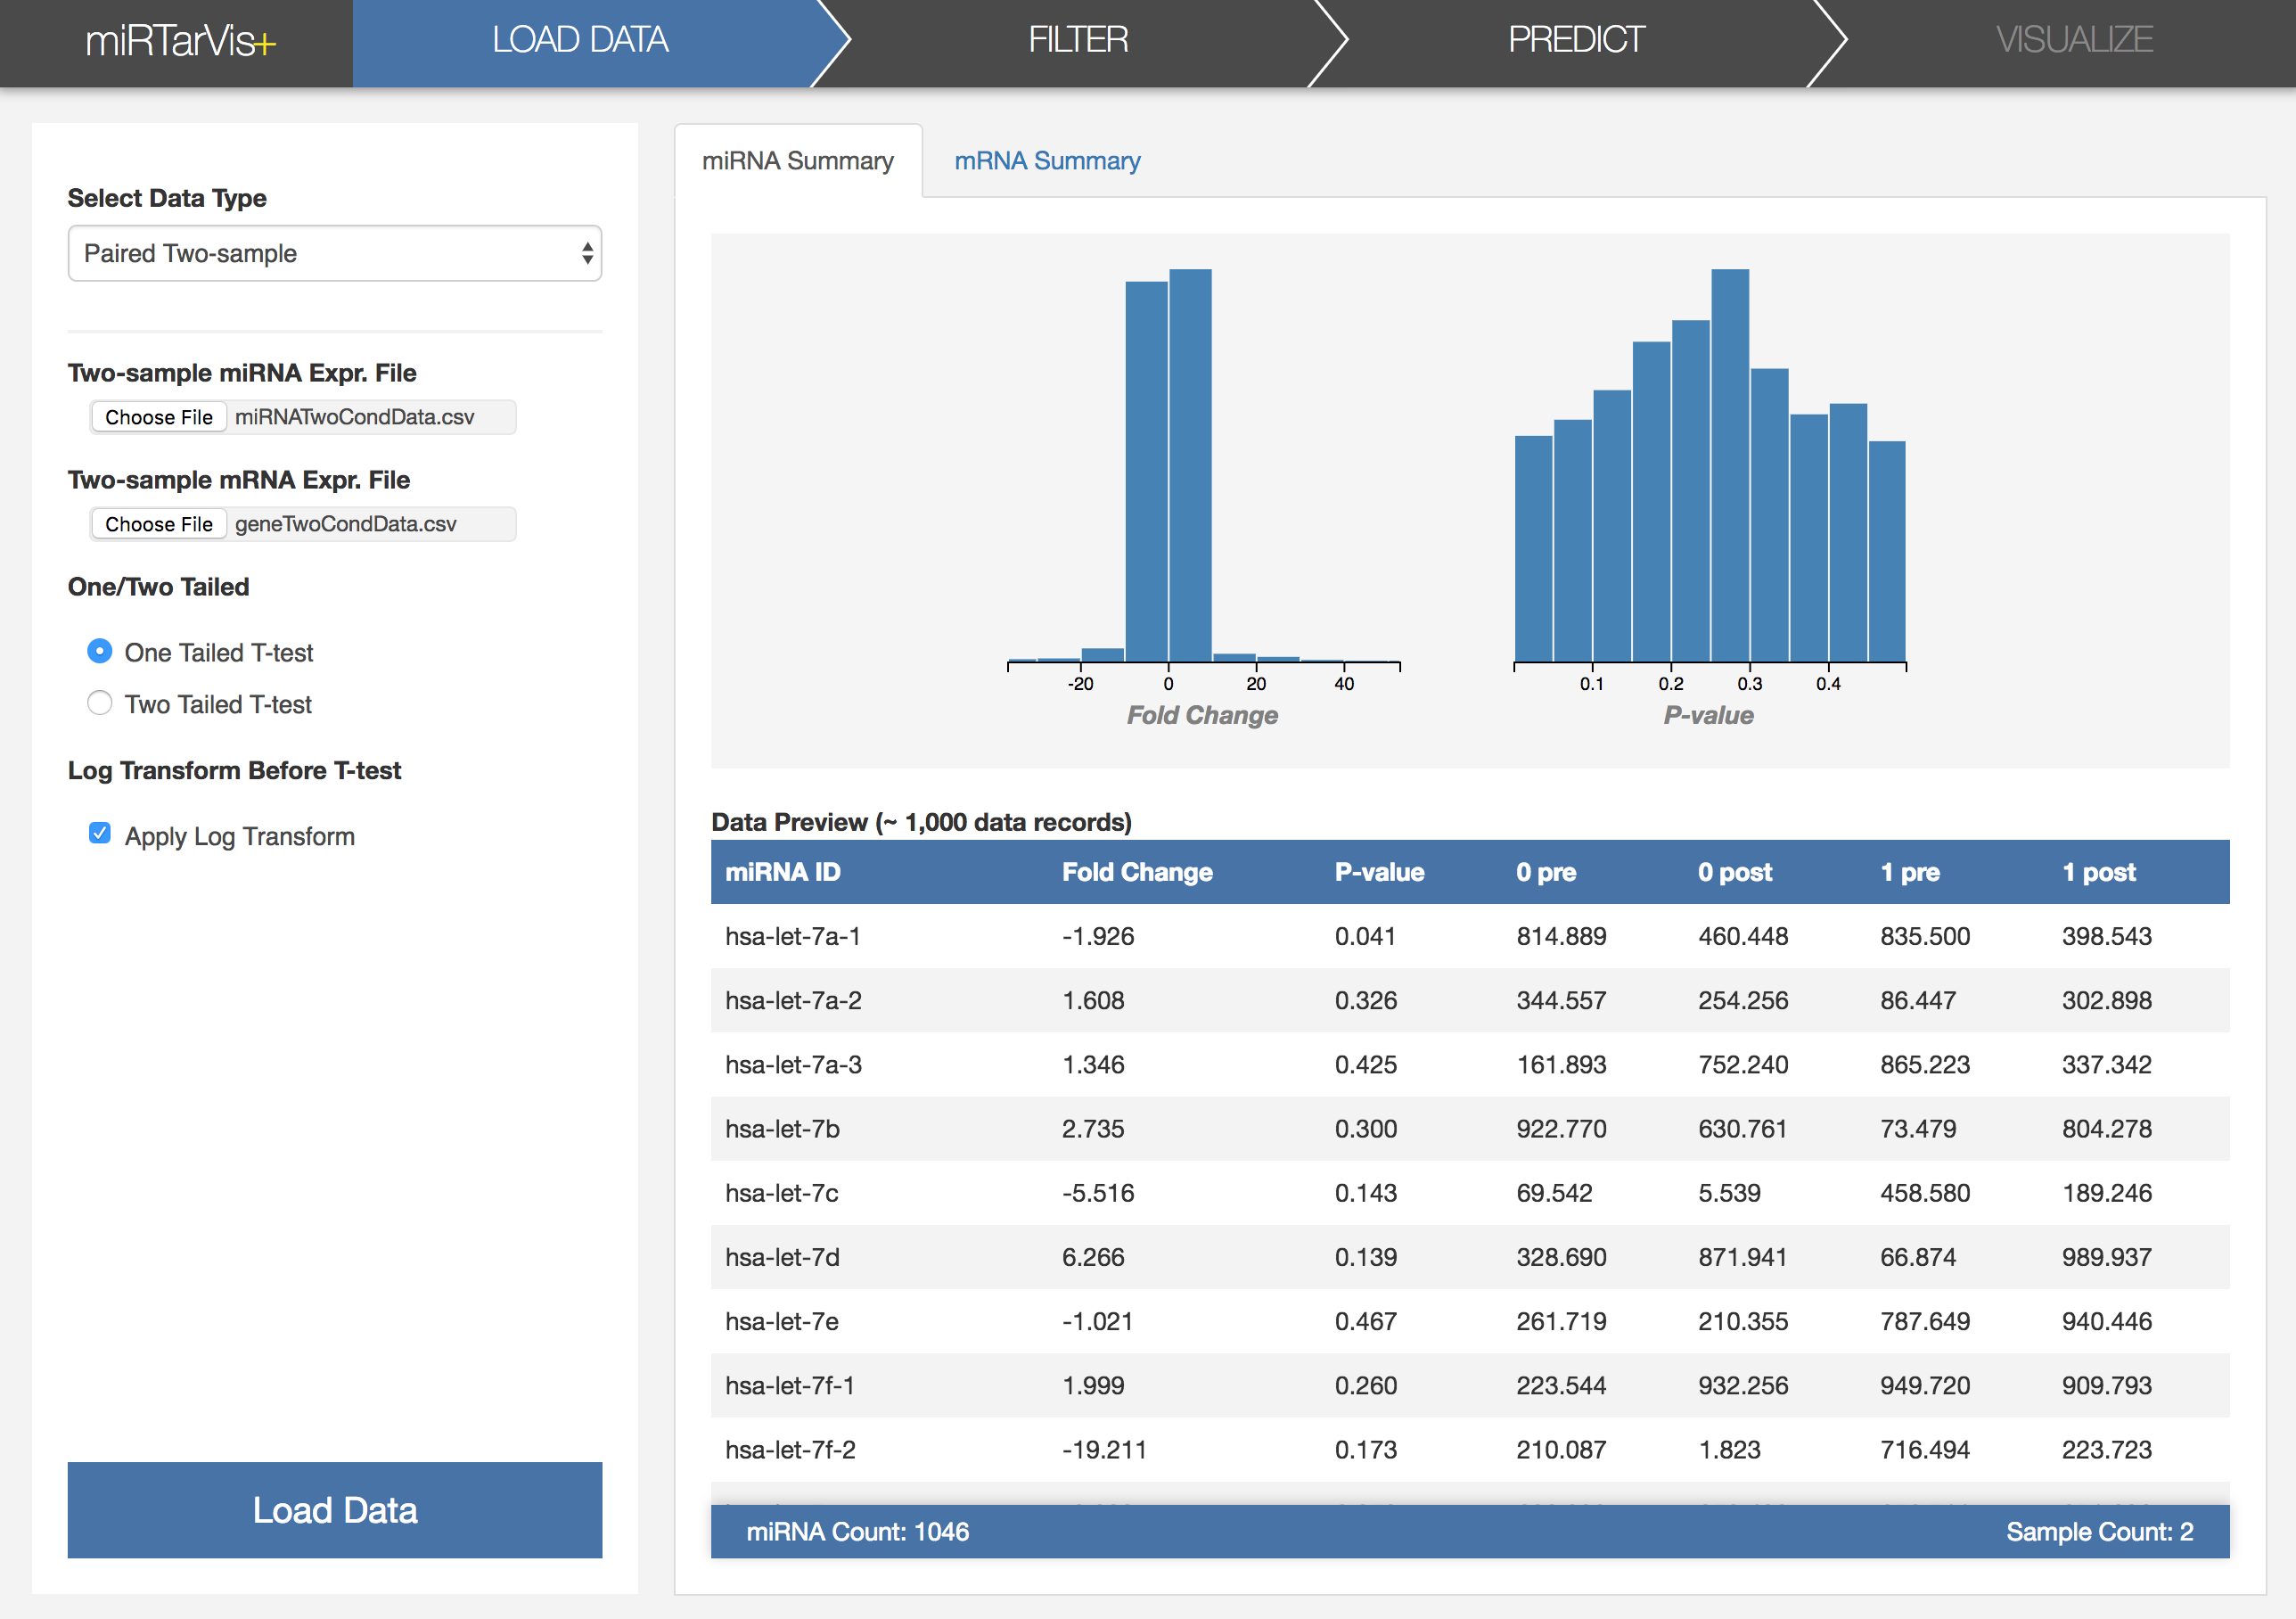
In the load menu, you can see five types of input data on the left side. Select "Paired Two-sample" (which is selected by default), and choose two files, one for a miRNA expression file and the other for a mRNA expression file. (Please do not confuse with the order of the two files!) Select the Load Data button on the below to start loading data. You can see loading progress with the progress bar on the right.
After loading these two data, miRTarVis+ calculates p-value and fold change right after the data load. Also, it shows distributions of p-value and fold change with histograms. The image on the below shows how miRTarVis+ looks like when loading is finished.
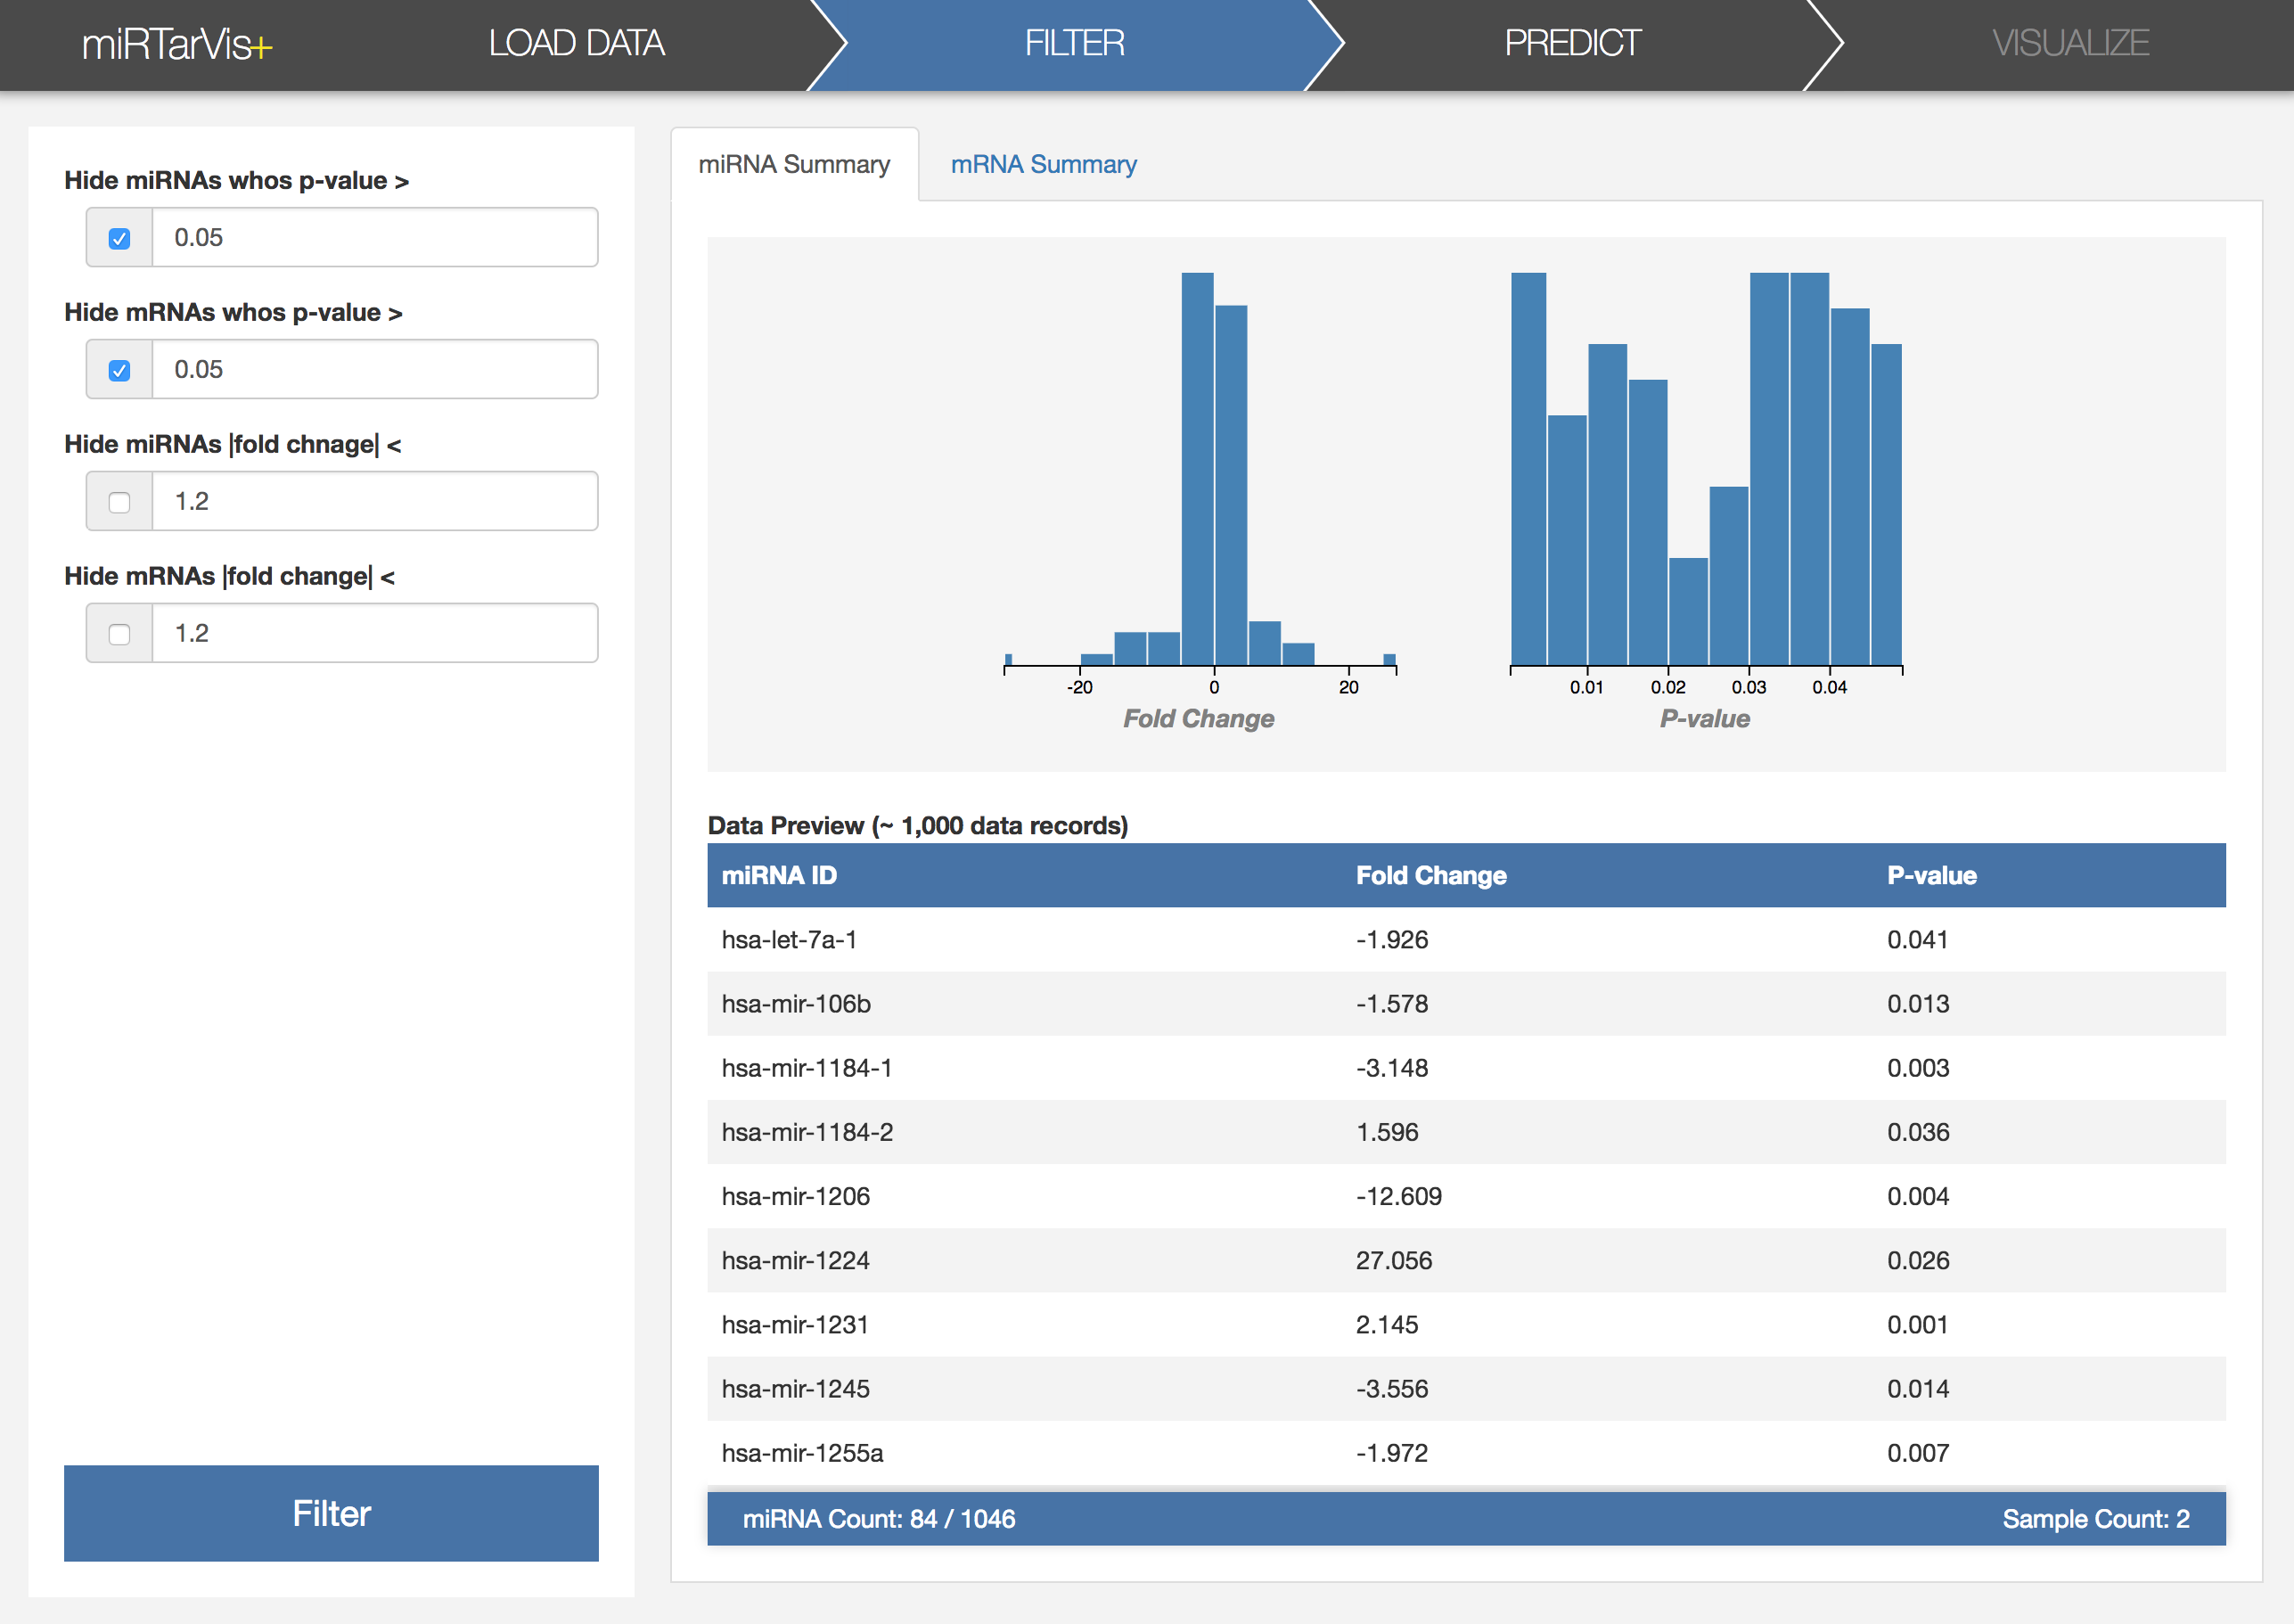
We want to search for differentially expressed miRNAs and mRNAs. As we have p-value for each miRNA or mRNA, it seems a good idea to use p-value to identify differentially expressed miRNAs and mRNAs. Let's click the Filter menu in the navigation. Then, it will show the filtering interface. Let’s filter the data by p-value by adjusting the threshold as 0.05 for both miRNA and mRNA. You can see that, now, the resulting histograms look different with the initial ones.
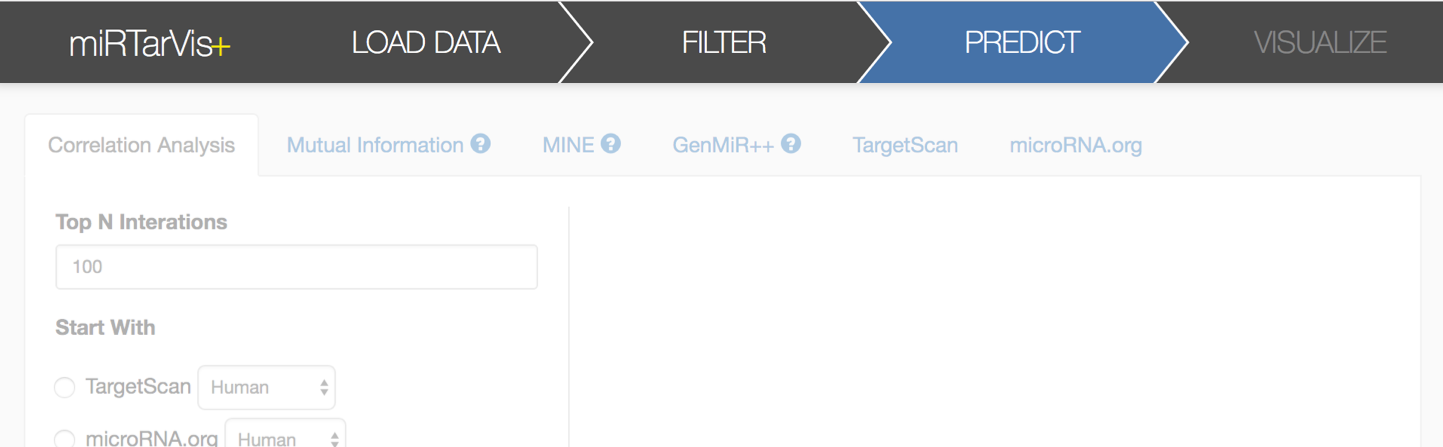
The next step is prediction. miRTarVis+ searches for possible miRNA-target pairs for the filtered data. miRTarVis+ supports two sequence-based prediction algorithms (TargetScan and microRNA.org) and four expression profile-based prediction algorithms (correlation analysis, mutual information, GenMiR++, and MINE analysis).
For now, let's use the simplest one, the correlation analysis. It searches for miRNA-mRNA pairs which have high correlation coefficients. I already conducted the correlation analysis, and the result looks like this.
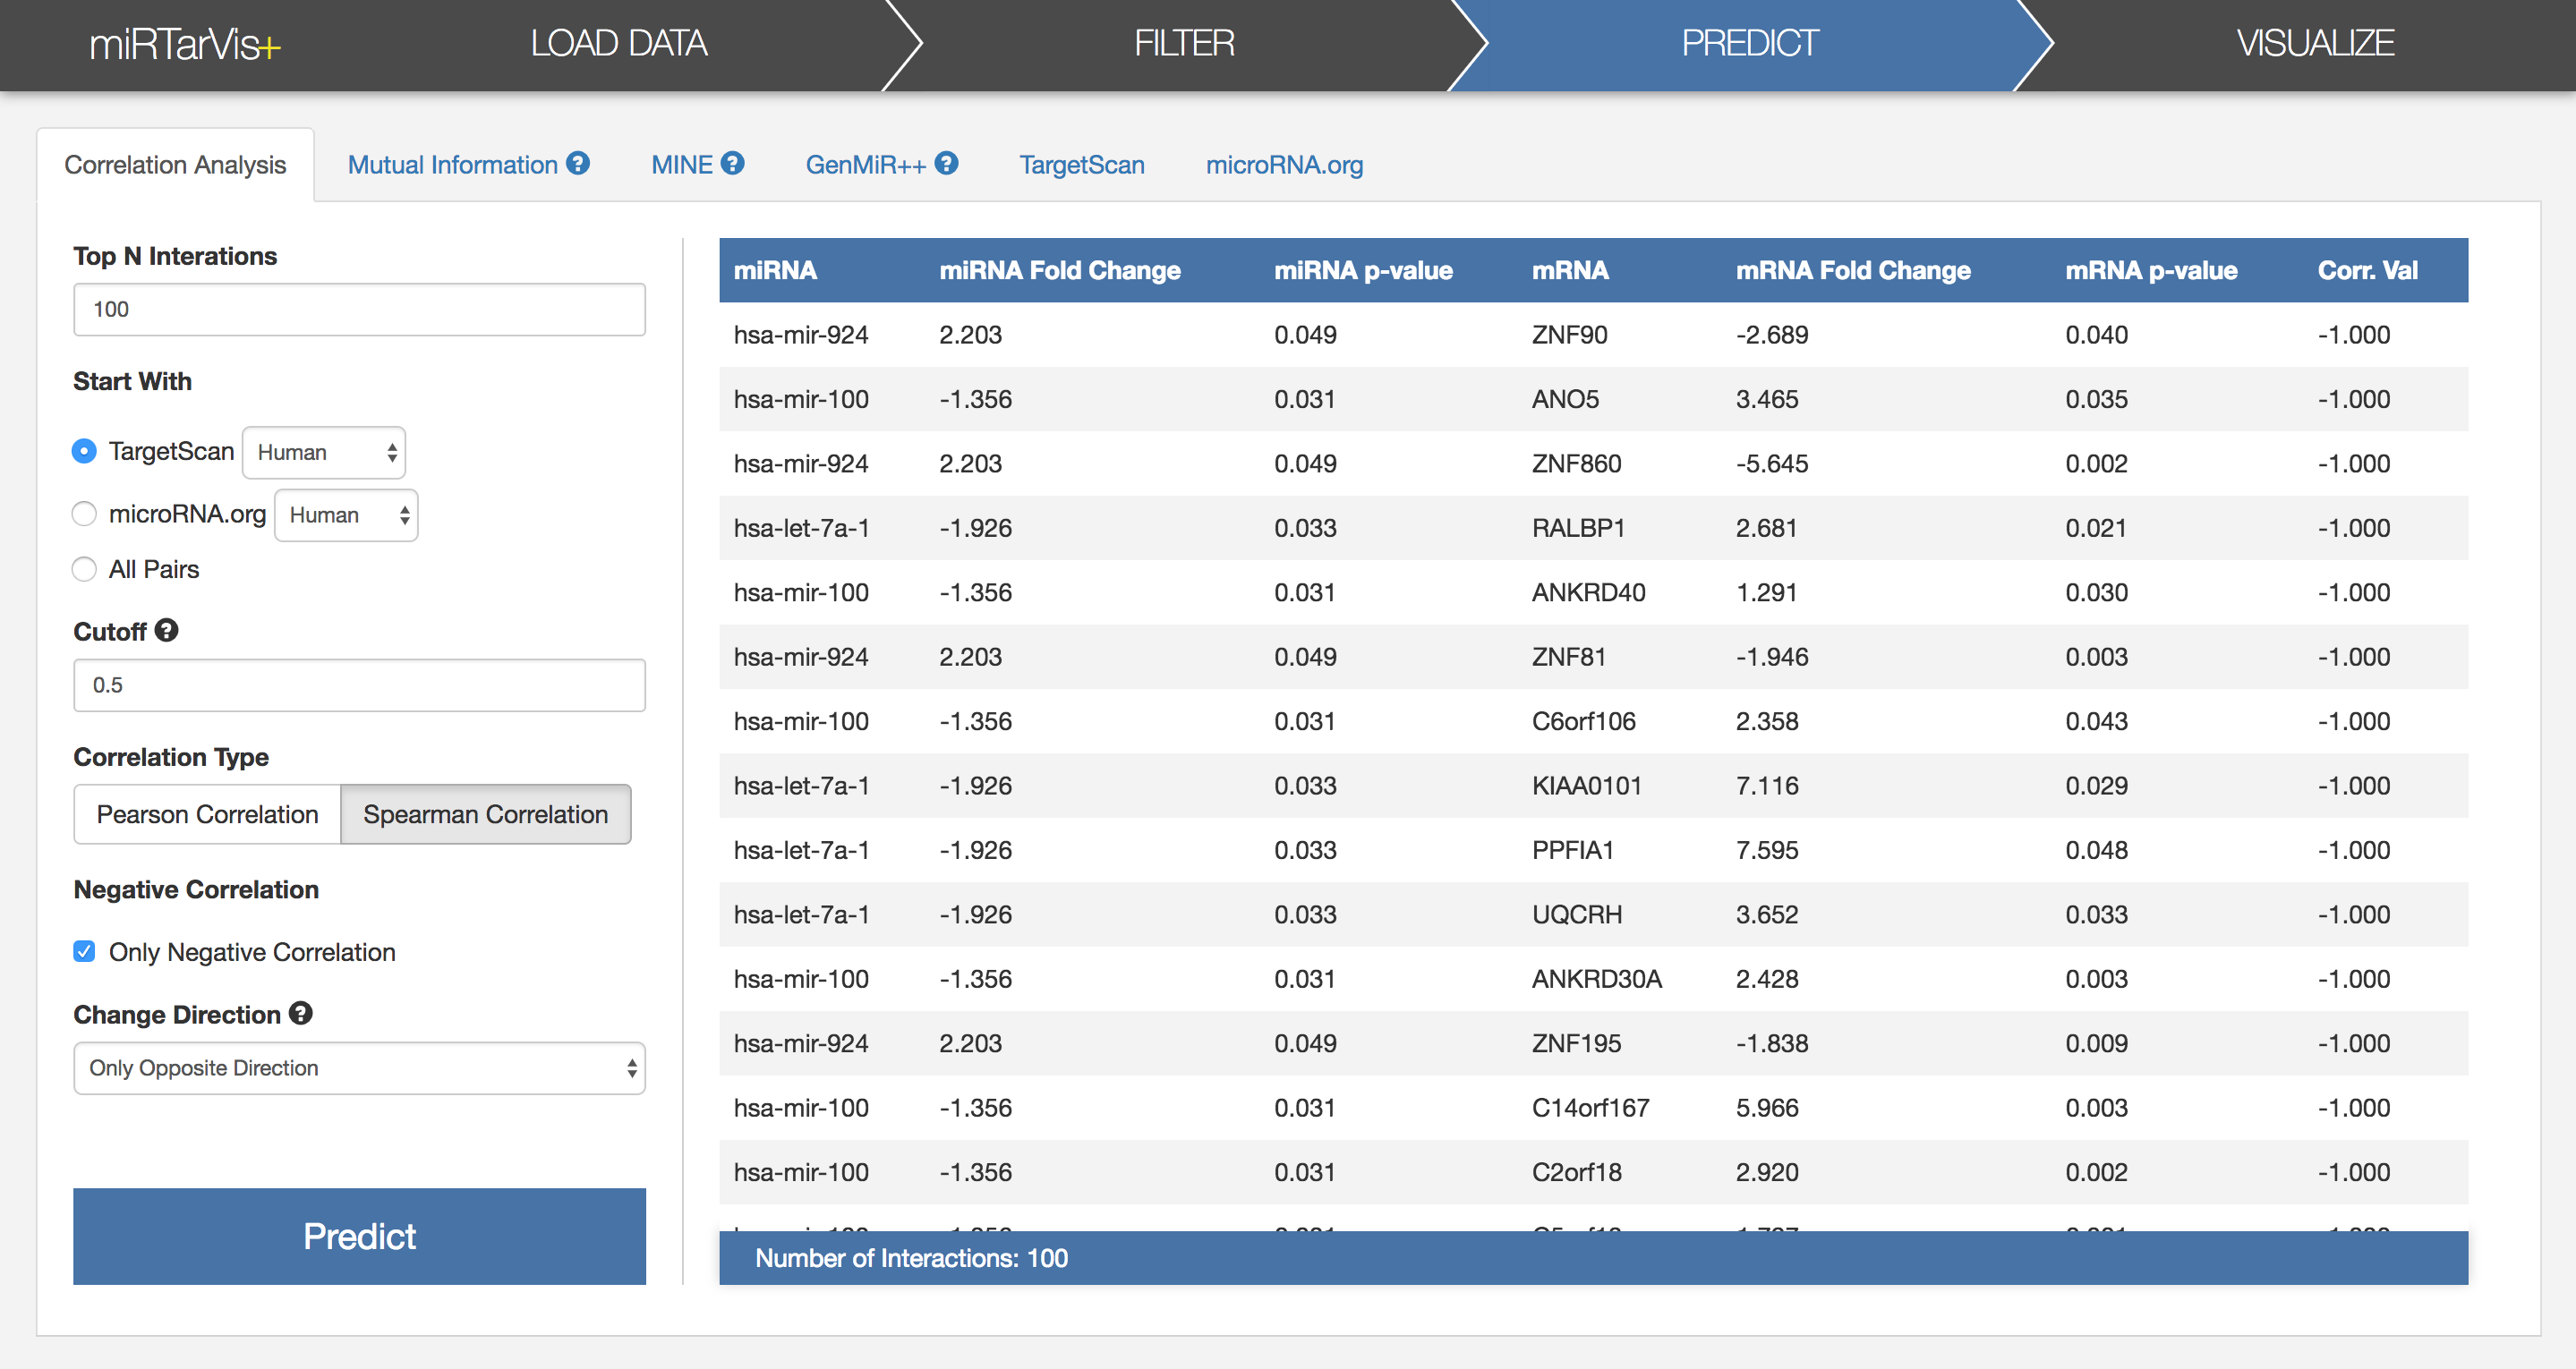
First of all, let's understand parameters of prediction algorithms.
After adjusting parameters, press the Predict button, then, miRTarVis+ will show the results in a table after finishing calculation.
Now, we have a miRNA target prediction result using Spearman correlation. Let’s move to the visualization step to visualize the result.
In the visualization step, there are three tabs for three visualizations: Prediction Overview, Node Link Diagram, and Treemap.
Let’s look at the Prediction Overview first.
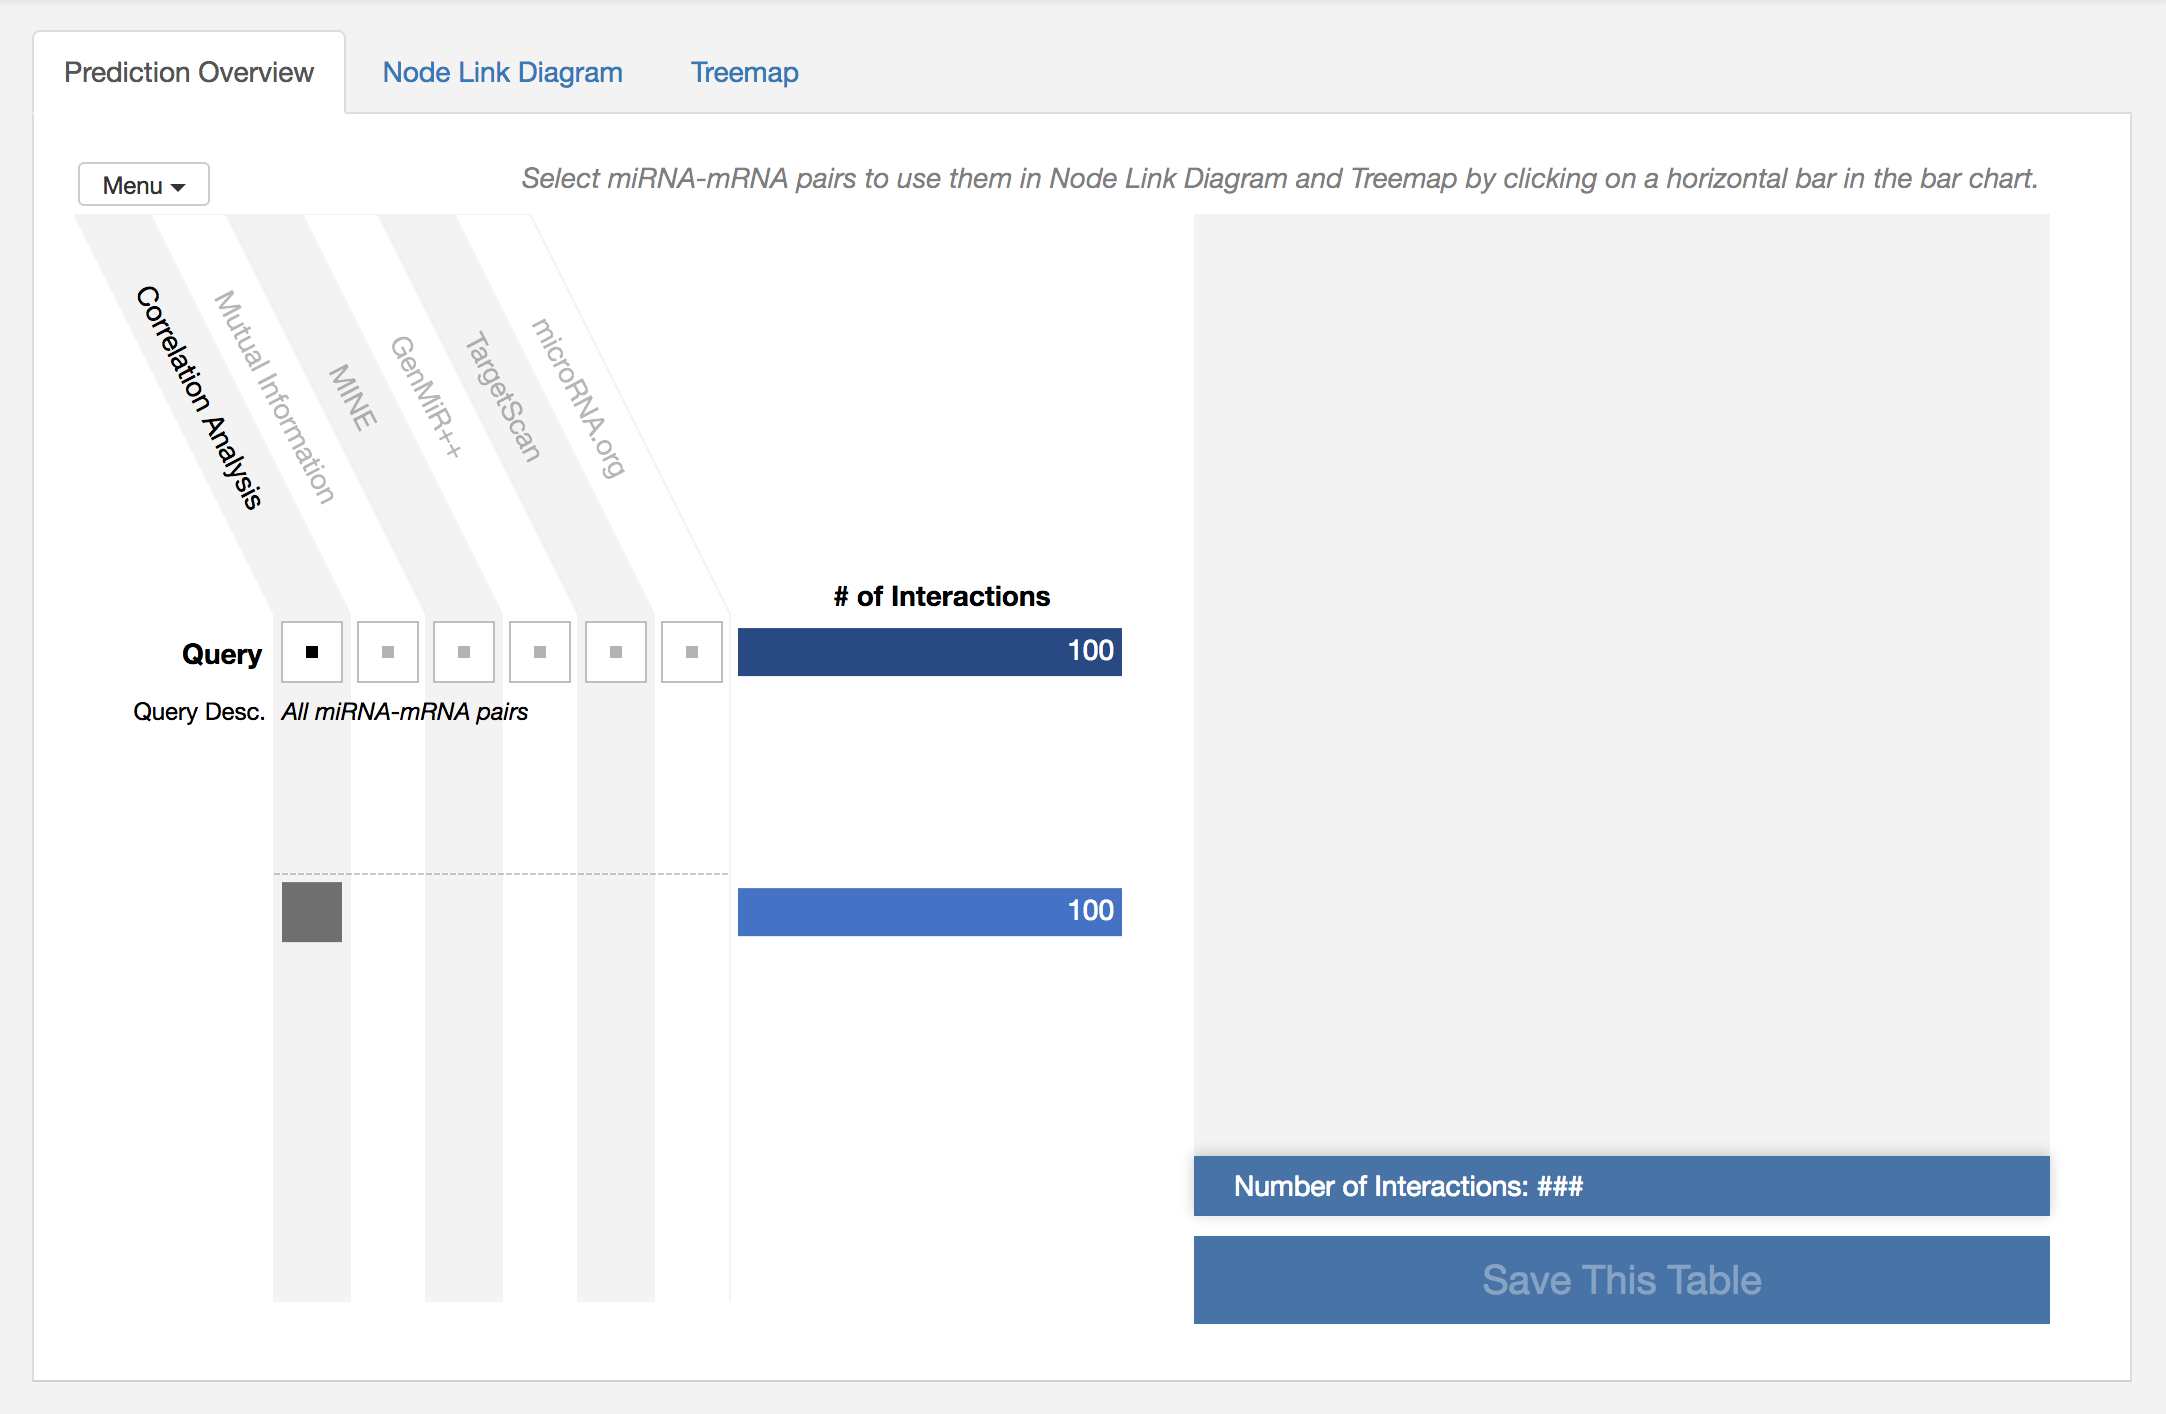
This overview shows the overall information about prediction results. In the visualization (on the left), columns represent prediction algorithms supported in miRTarVis+, and rows represent subset among all results. Since we only have a result using correlation coefficient, only first column is enabled, and there is only one row. At the end of each row, there is a bar which represent the number of miRNA-mRNA pairs in the subset. As we set the parameter of Top N Interactions as 100 when conducting prediction algorithm, we have 100 miRNA-mRNA pairs!
Now, we want to see the result in detail using Node Link Diagram and Treemap. So let’s click on the bar to select the bar containing 100 miRNA-mRNA pairs.
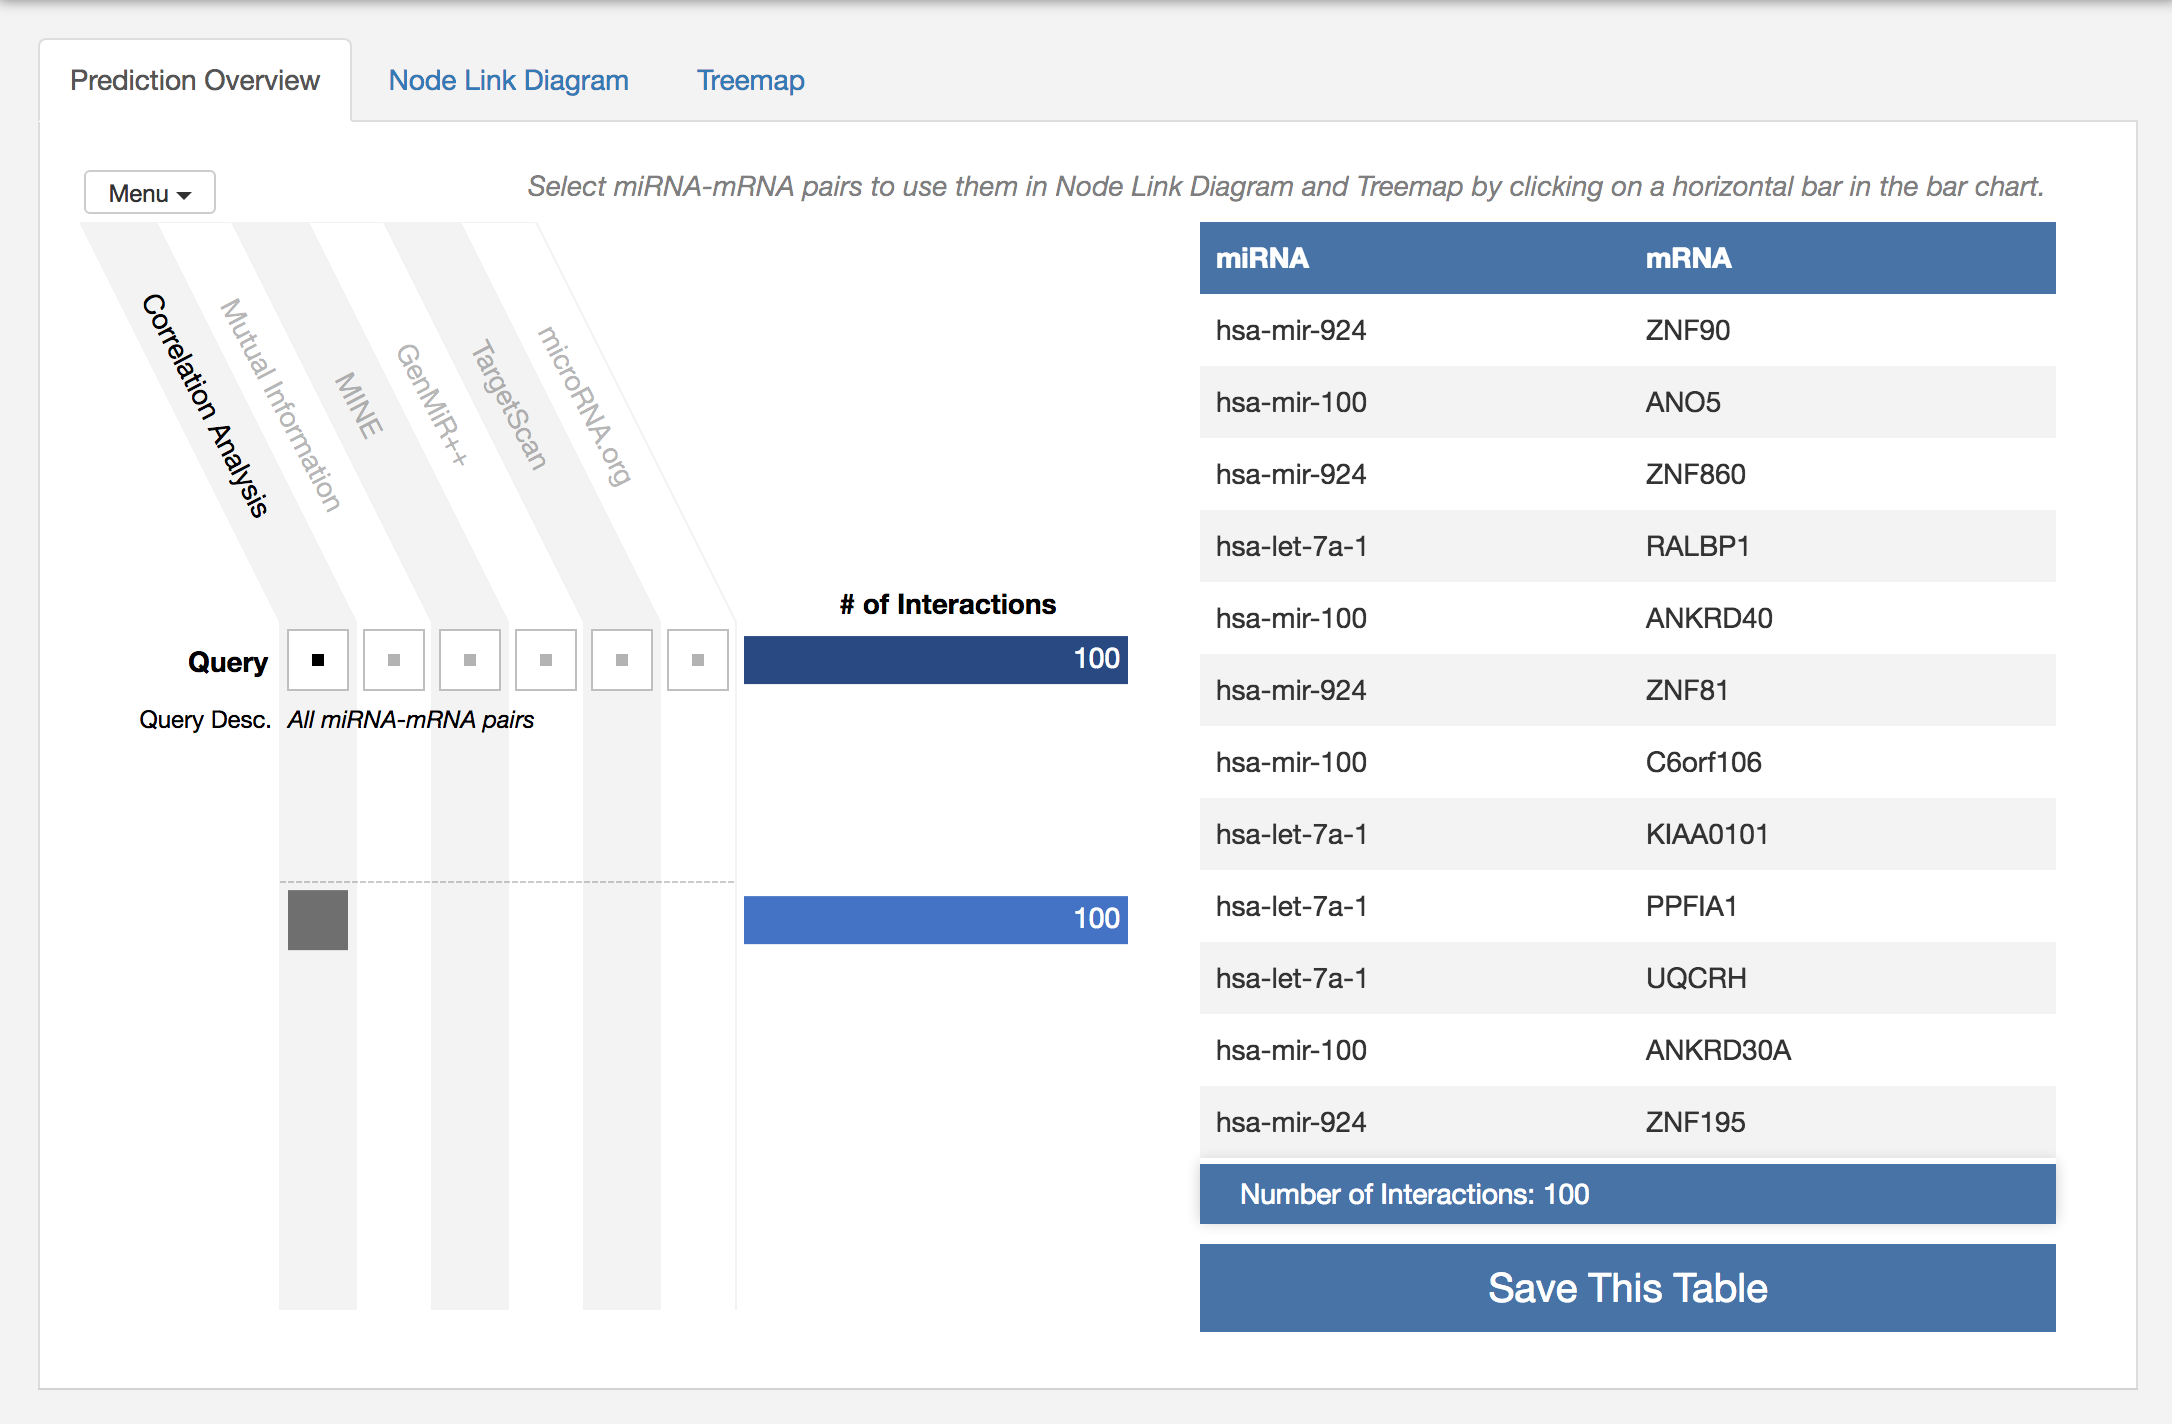
miRTarVis+ shows all 100 pairs with table on the right.
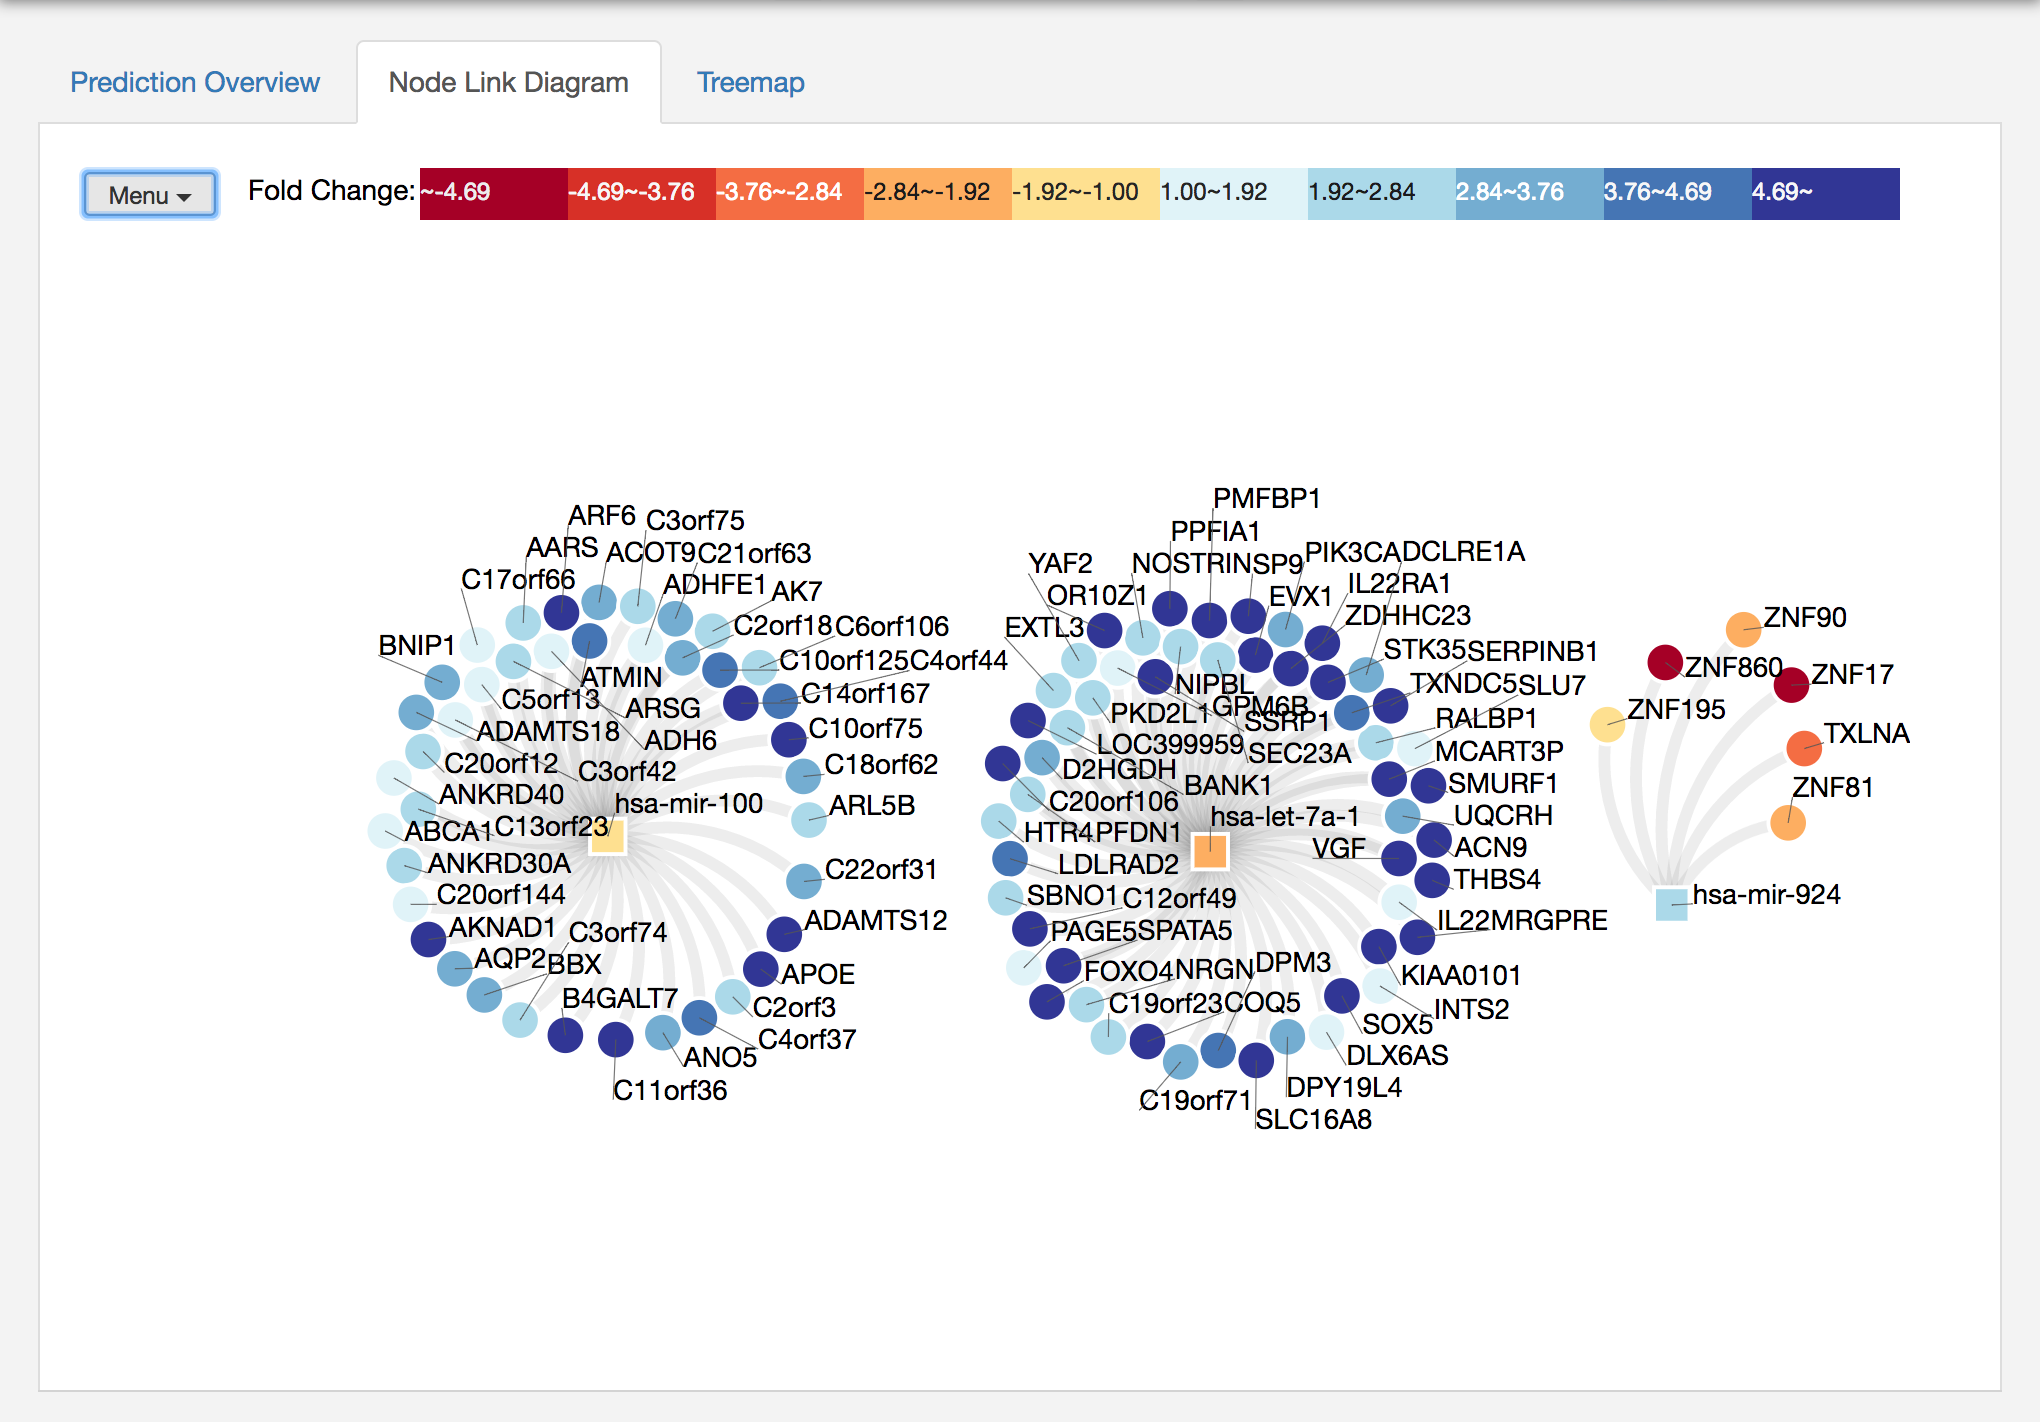
Now, miRTarVis+ visualizes the selected miRNA-mRNA pairs to help you understand the miRNA-mRNA network structure. Traditionally, this kind of network is visualized using a node-link diagram, and miRTarVis+ also supports a node-link diagram.
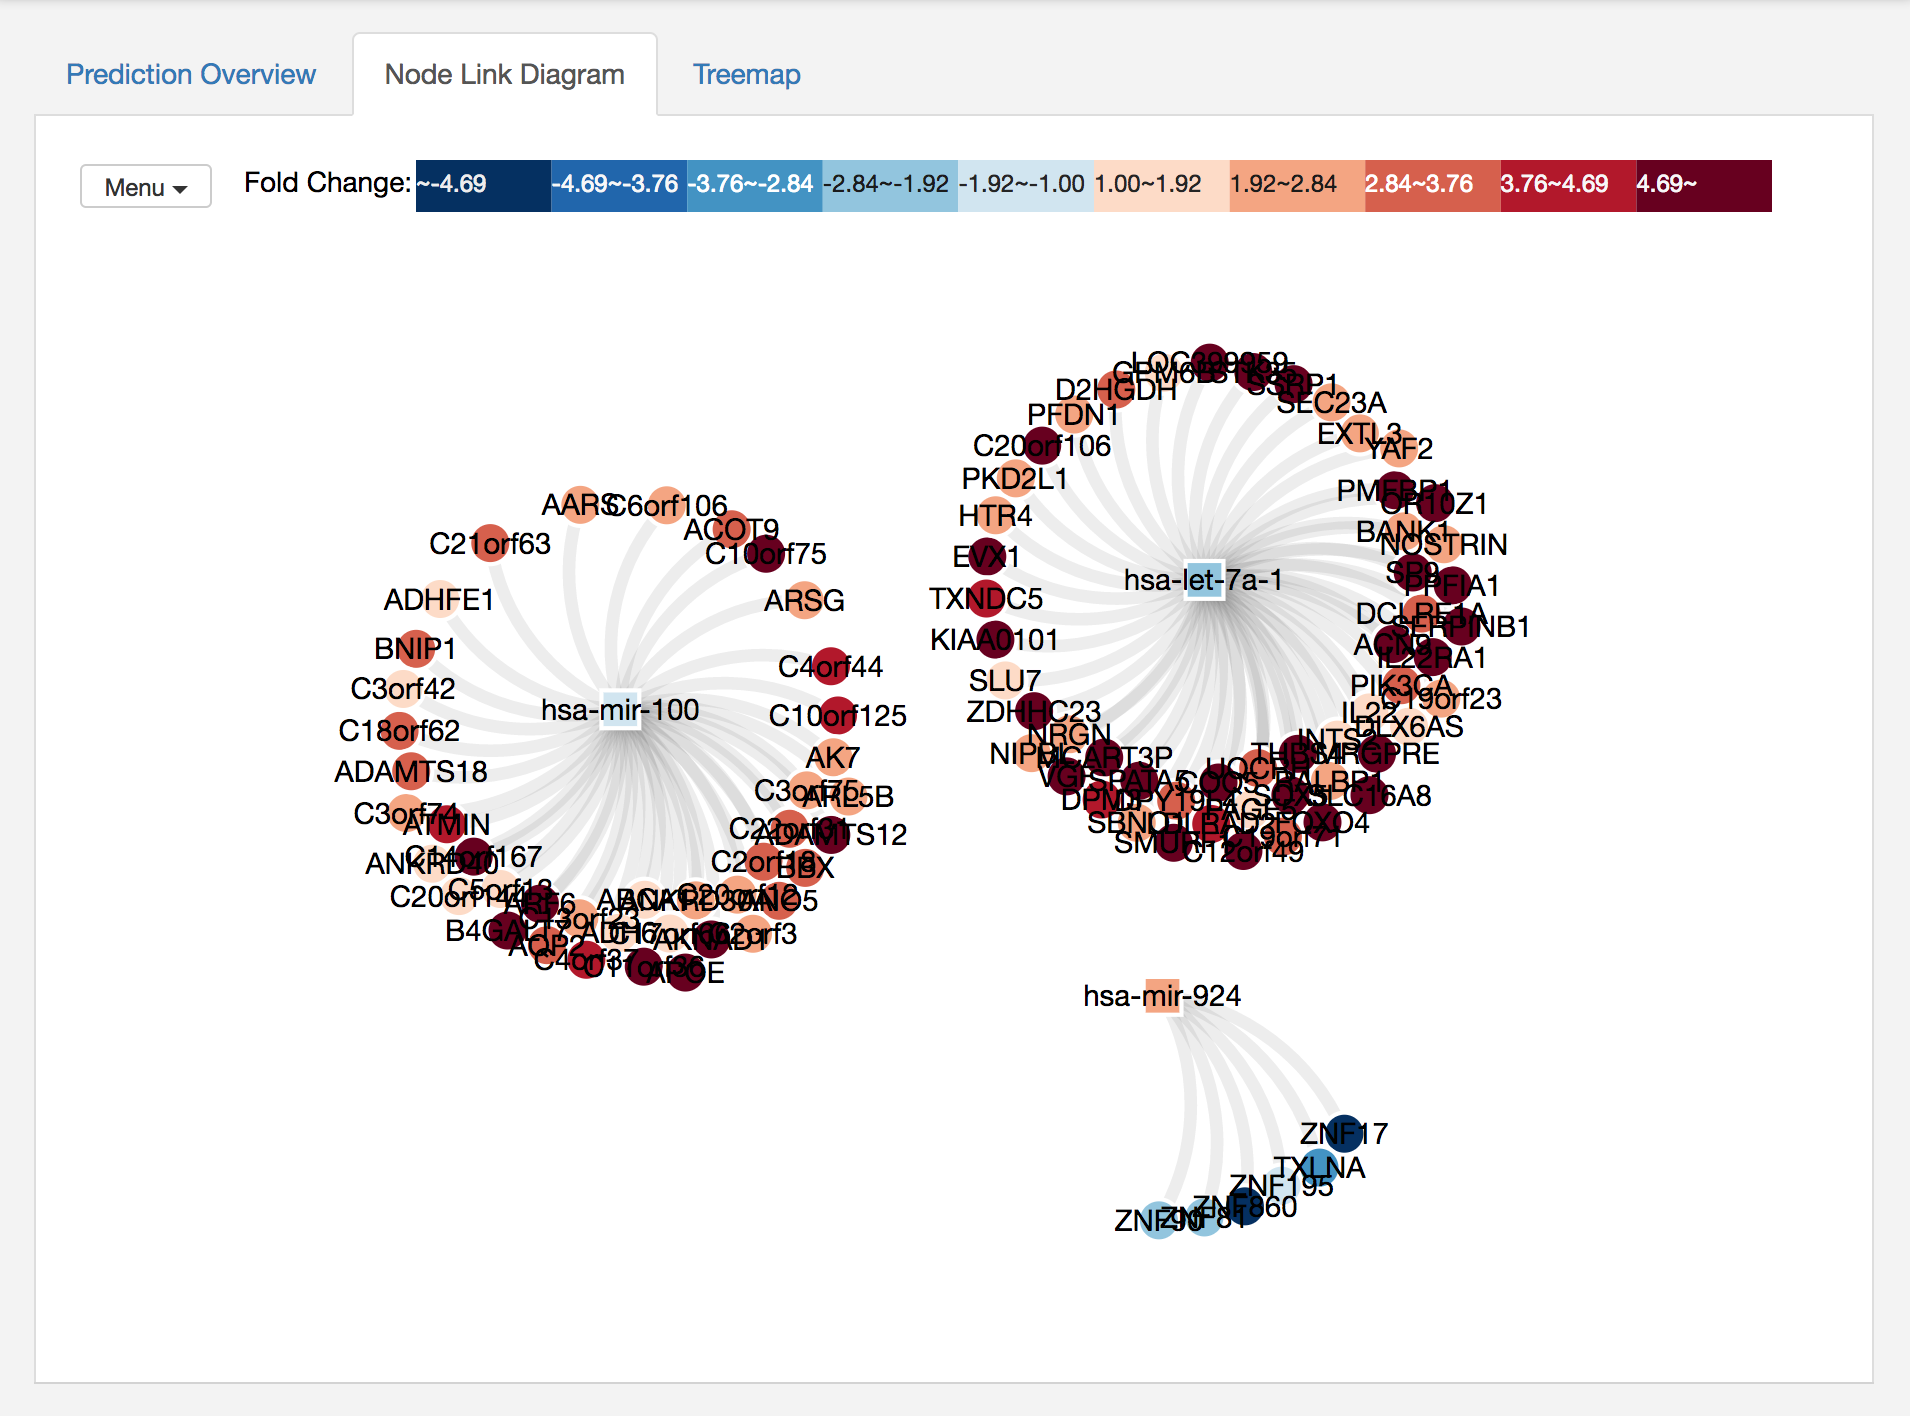
You can select a node and highlight its neighbors, or you can move a node by dragging. If you click on a miRNA and shift-click on another miRNA, then miRTarVIs+ will highlight all their common targets. miRTarVis supports zoom in/out using simple mouse wheel and drag interactions. On the top left corner, there is Menu where you can find lots of useful features for the node-link diagram. The features include
After using some features in the Menu, the network looks better to me :)
In addition, miRTarVis+ shows the network in an interactive treemap visualization. See the following image.
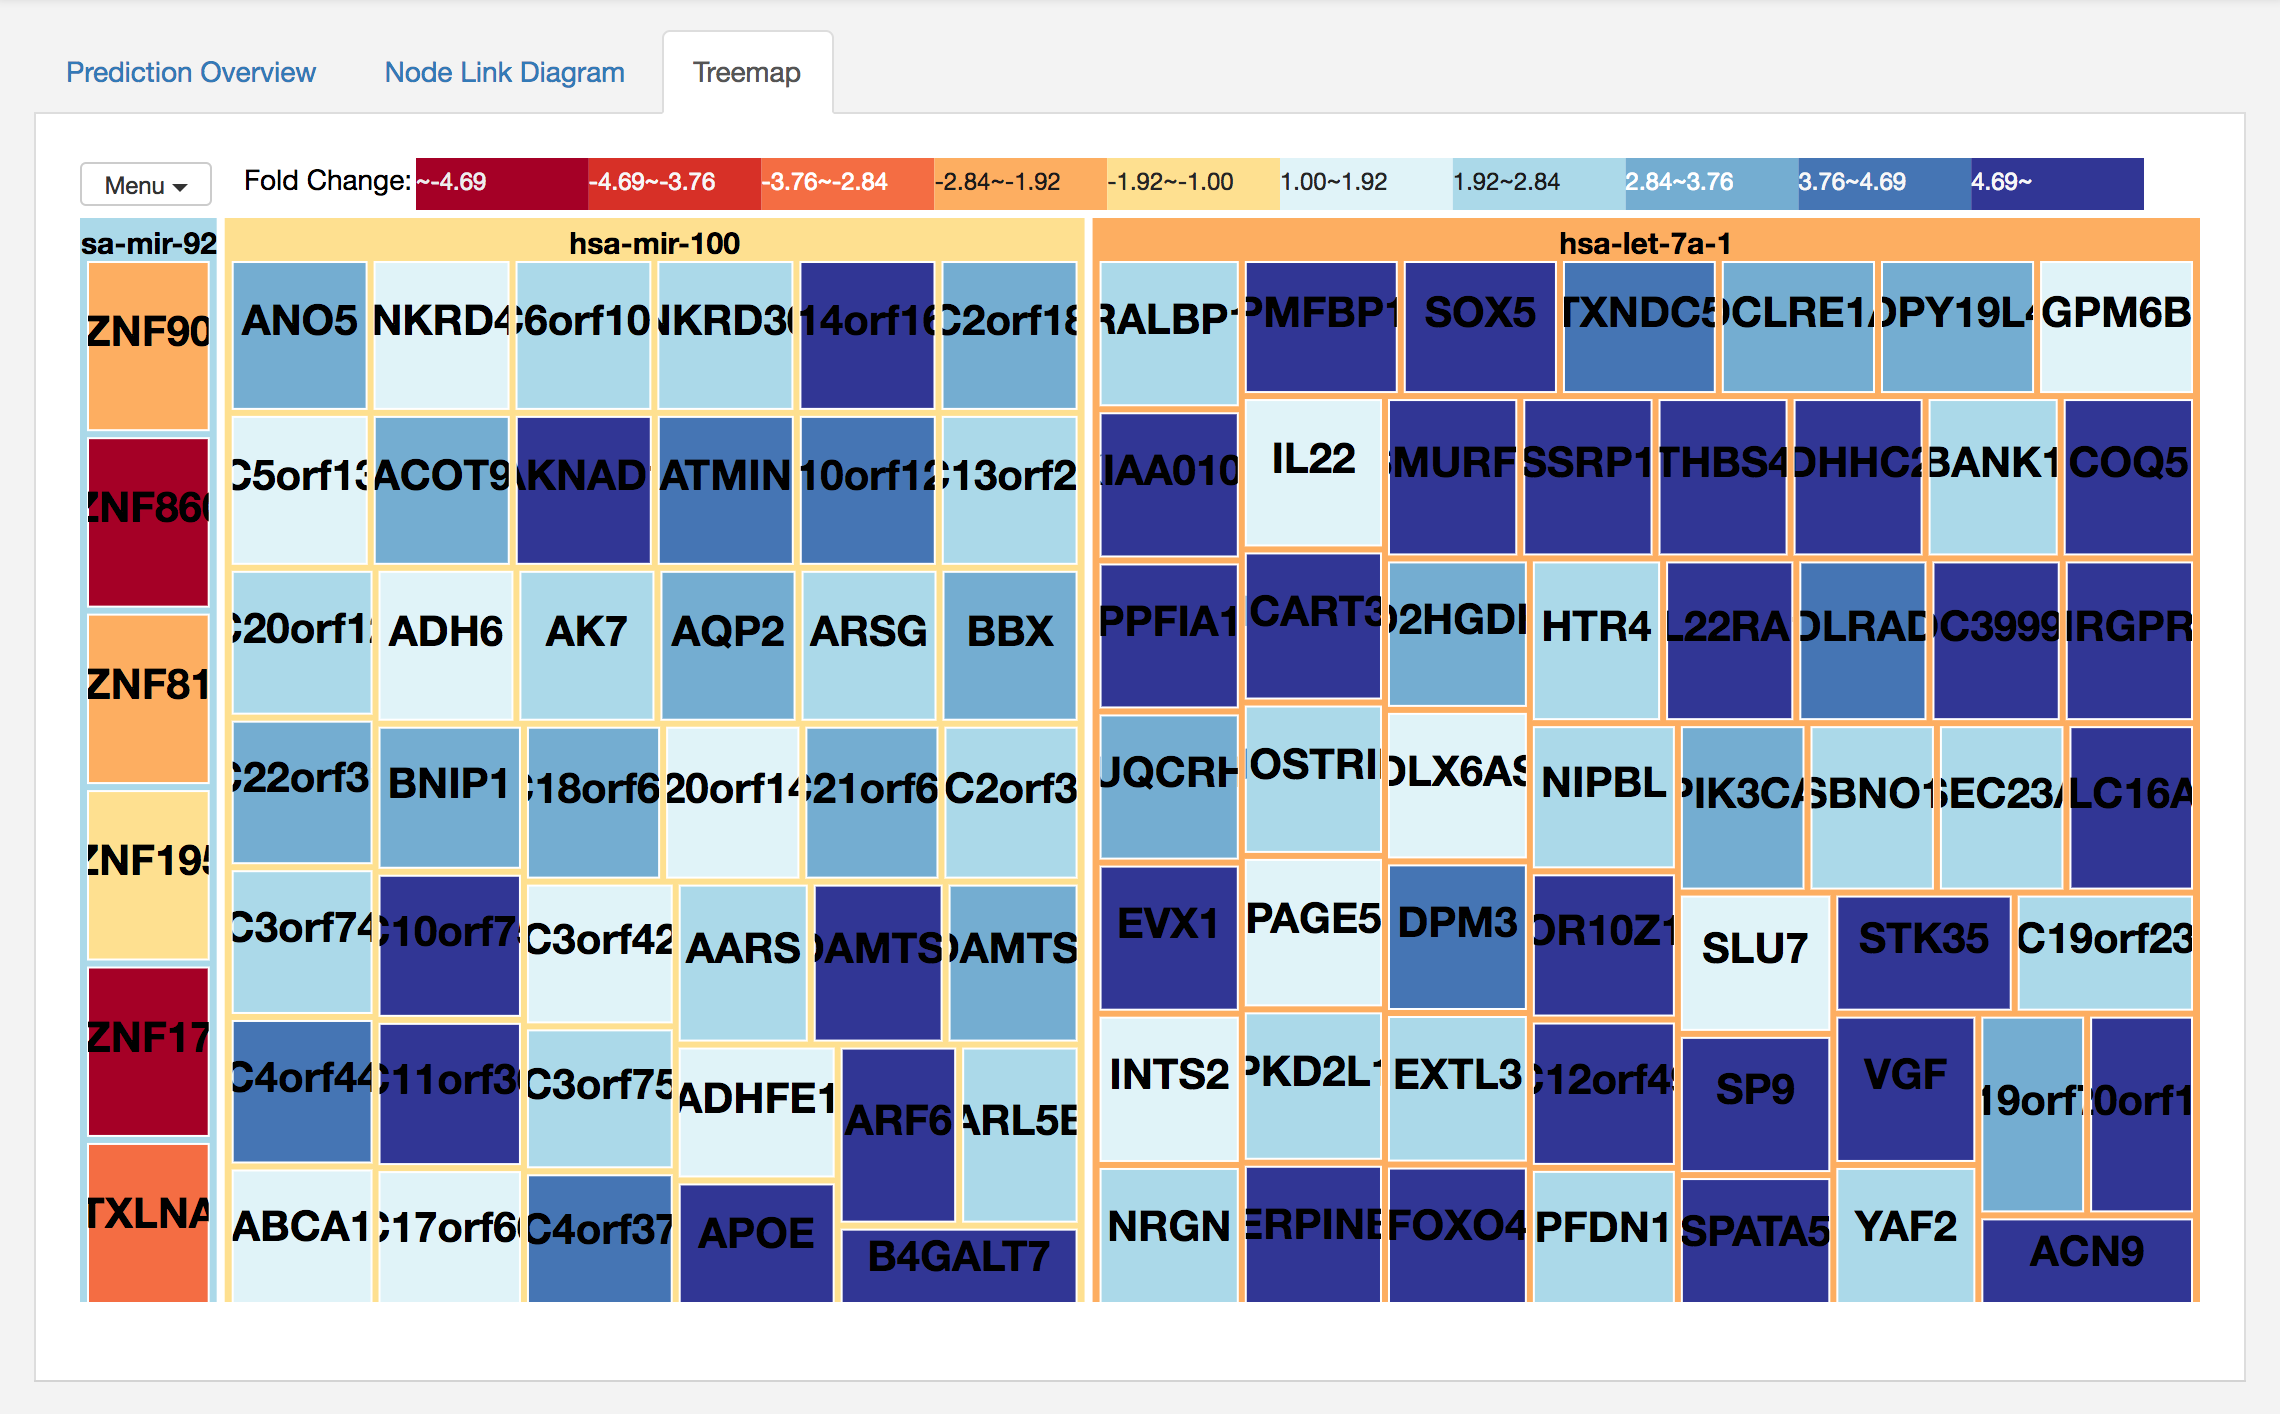
This visualization shows the same network that node-link diagrams did. This two-level treemap shows miRNAs as first level nodes and their targets as their child nodes.
In both visualizations, color represents fold change values of miRNAs and mRNAs.
There were other functions such as link to external databases in both the visualizations. You can do this by right-click on a node in node-link diagram or treemap visualizations. I want to end this tutorial with one of these functions: Term Enrichment analysis in Gene Ontology web service. If prediction result is biologically meaningful, we can expect that predicted targets of a miRNA has common biological function. To help verifying that, miRTarVis+ provide a link to Term Enrichment analysis from Gene Ontology web service.
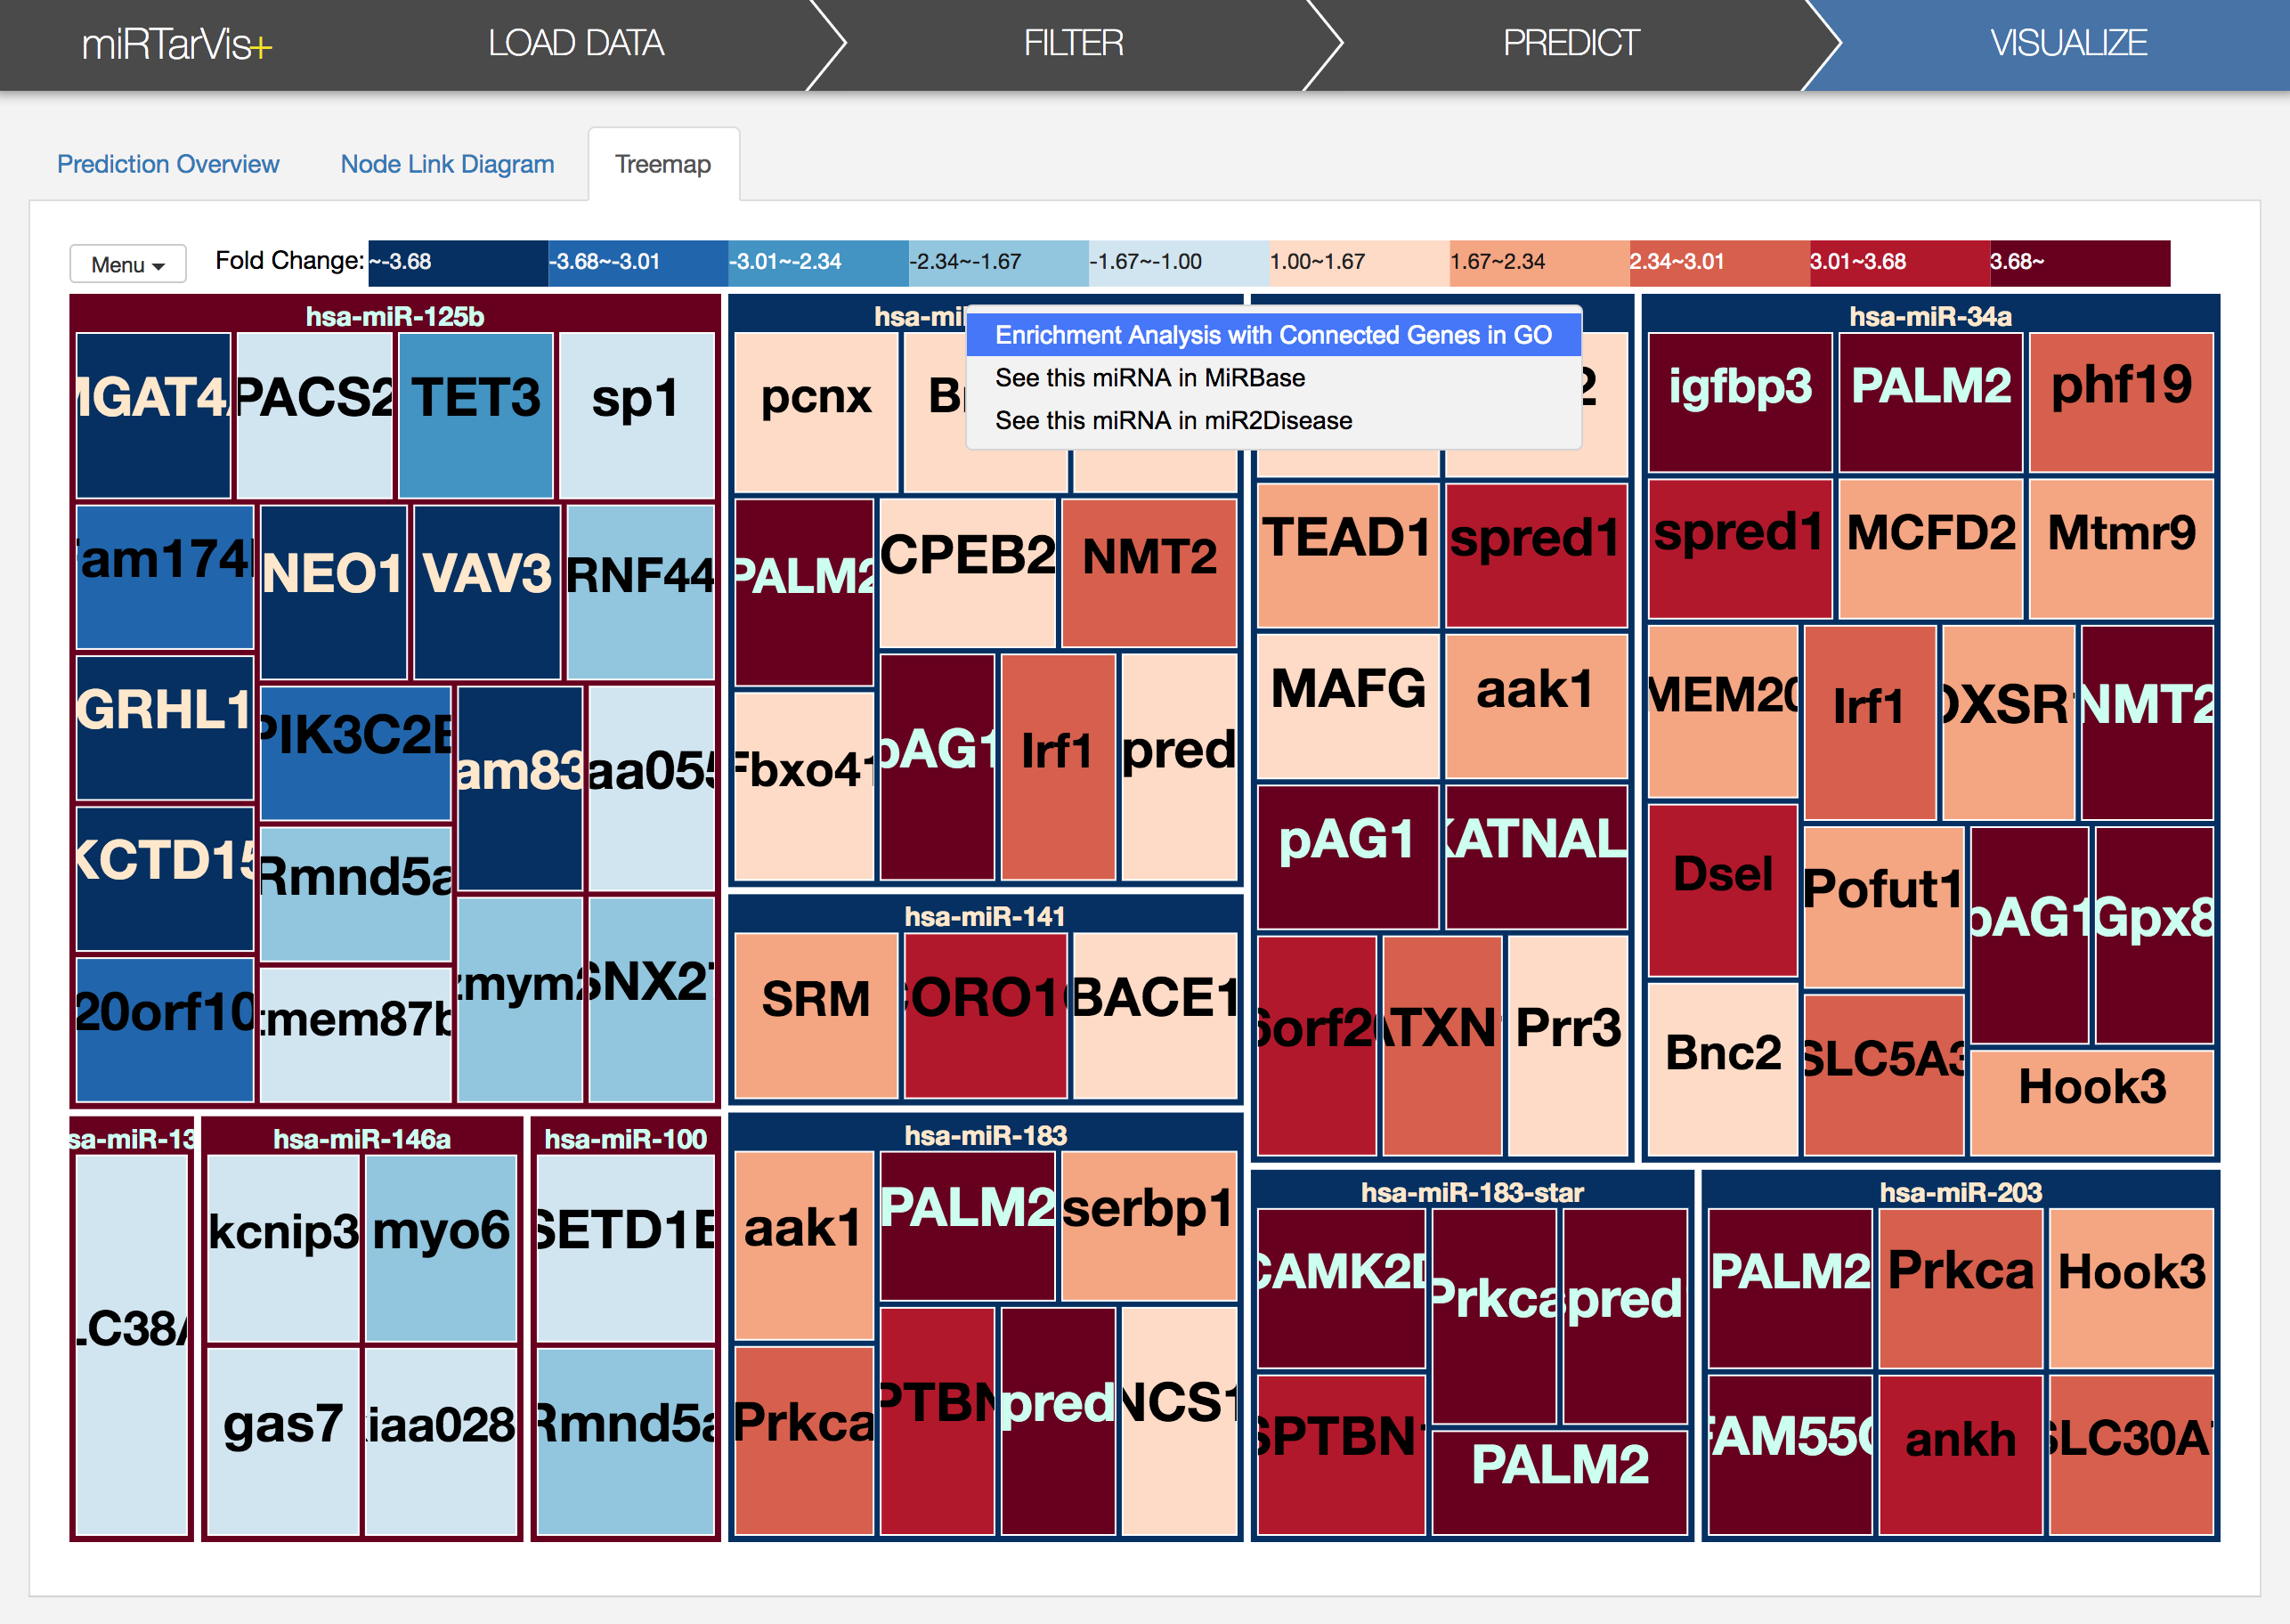
If you click the "Enrichment analysis connected genes in GO" in a context menu,
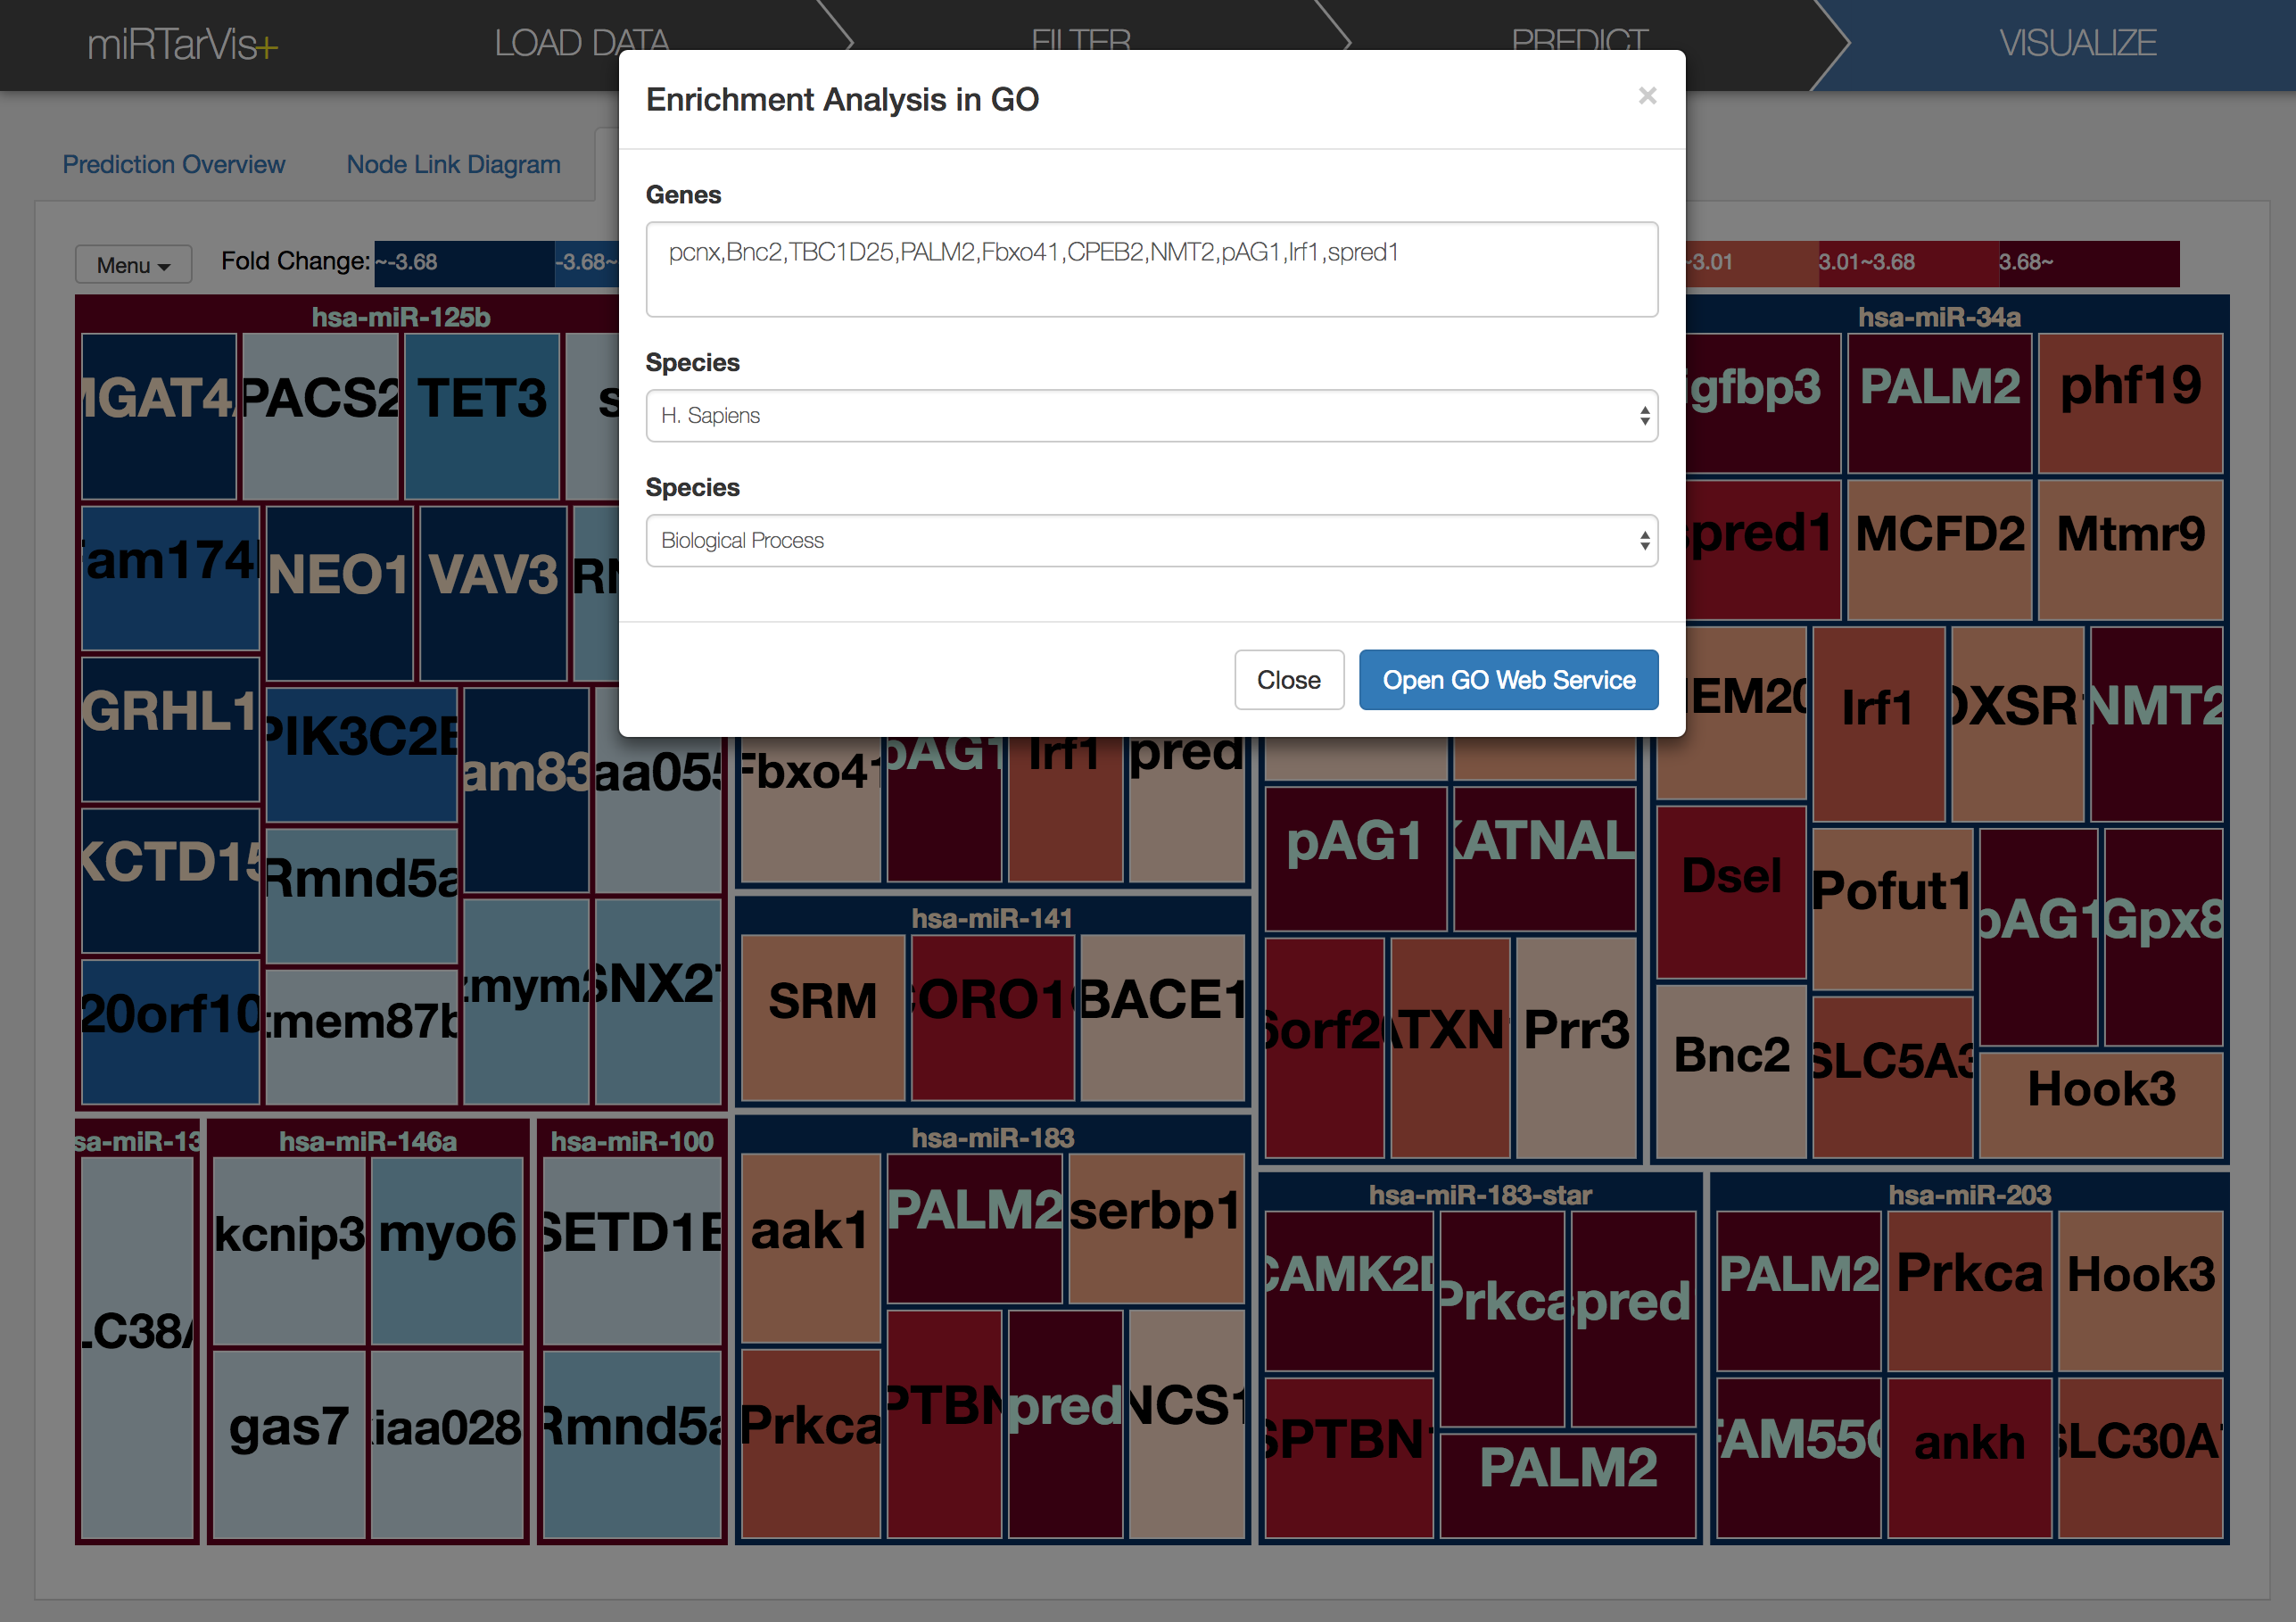
a dialog will appears like this. It shows all predicted targets of miRNA (hsa-mir-106a for here). After setting species and ontology as you want, let's click 'Open GO Web Service' button in the dialog. Then, enrichment analysis result will appear in your default browser. Sometimes the network request times out when there are many target mRNAs, so no results will appear after long time. In such circumstances, please try it again later.
If you have any question, or find some bugs while using miRTarVis+, please feel free to contact me (email: shlyi@hcil.snu.ac.kr).