 arXiv 2026
TVCG 2026
Bioinformatics 2023
TVCG 2023
TVCG 2022
I’m a NIH K99/R00 Postdoctoral Fellow at Harvard University in informatics working with Nils Gehlenborg. I received PhD in Computer Science and Engineering from Seoul National University with the supervision of Jinwook Seo at the Human-Computer Interaction Lab.
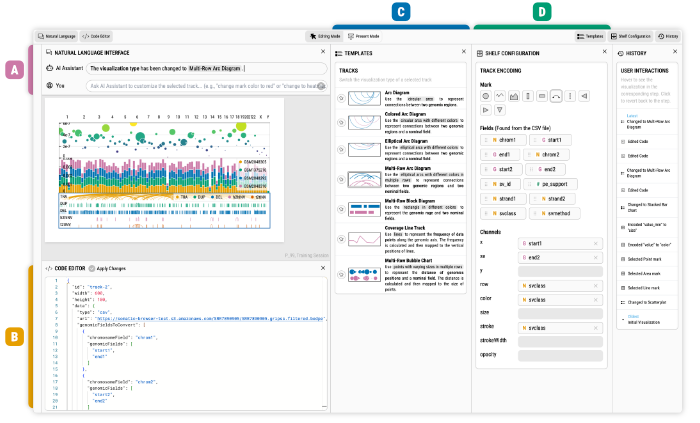
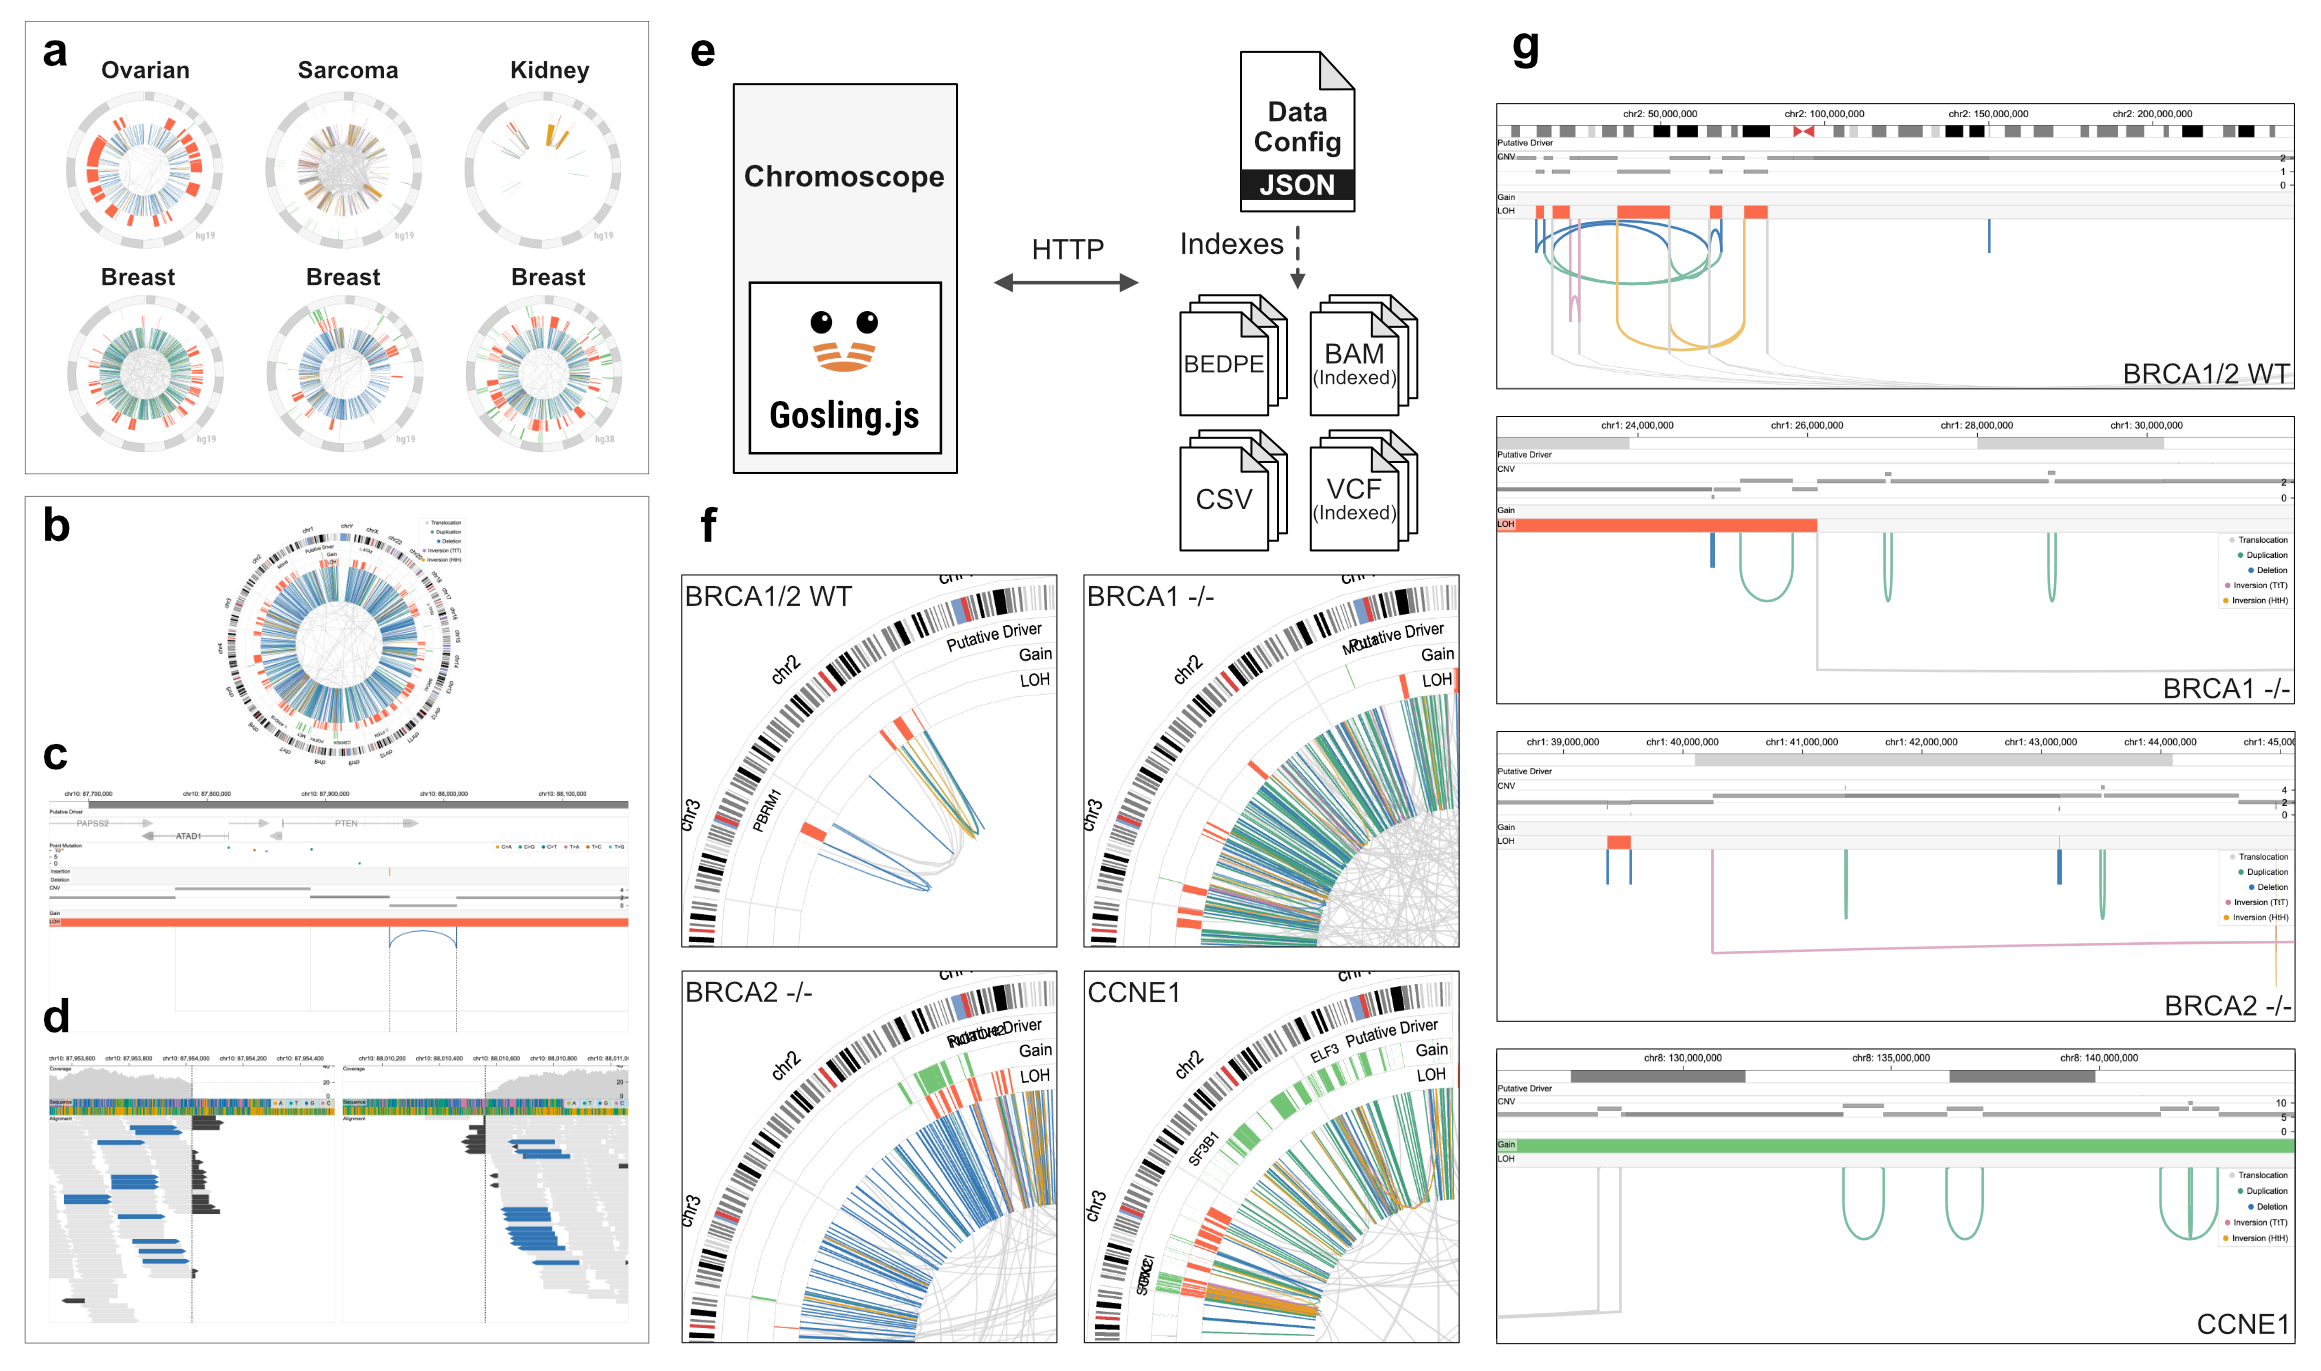
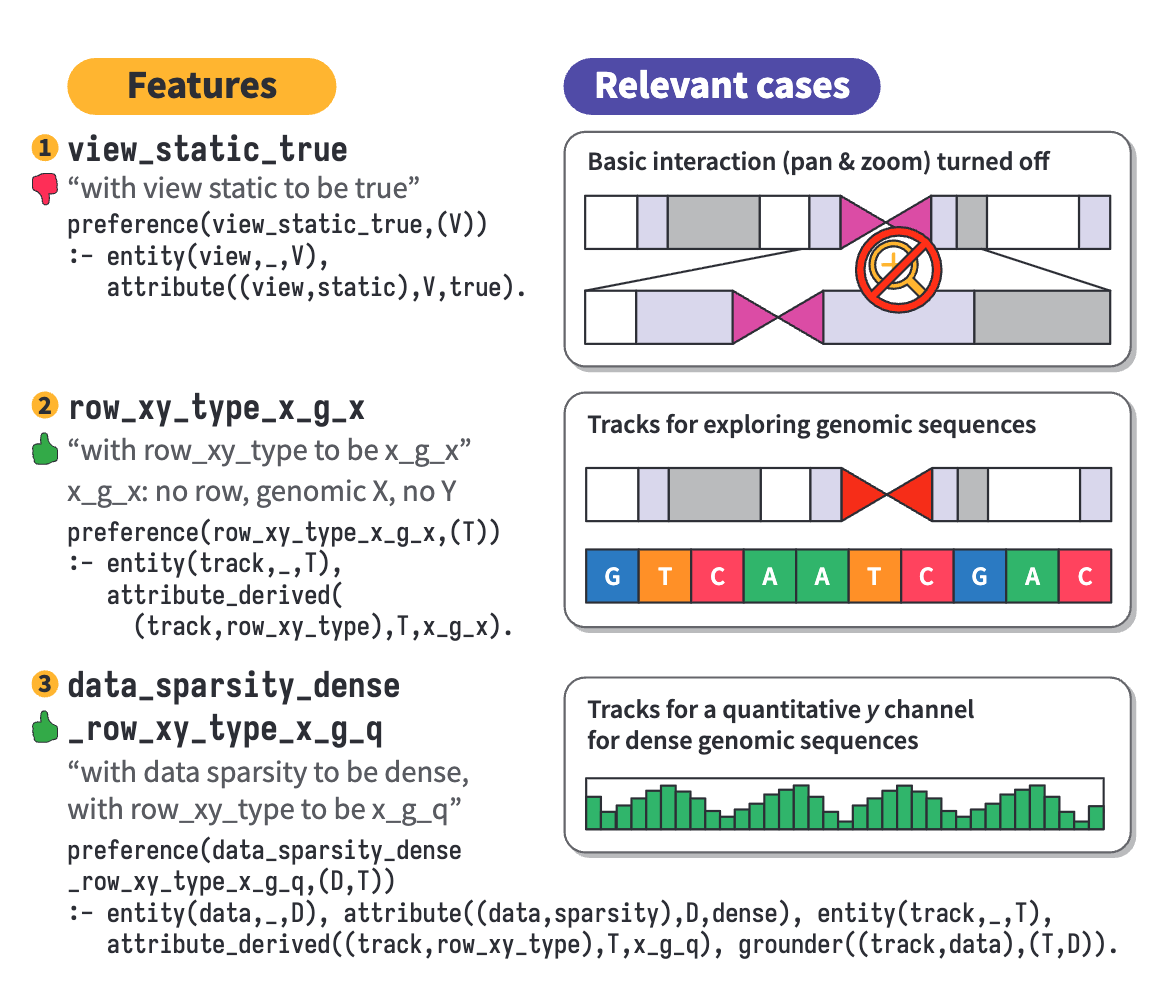
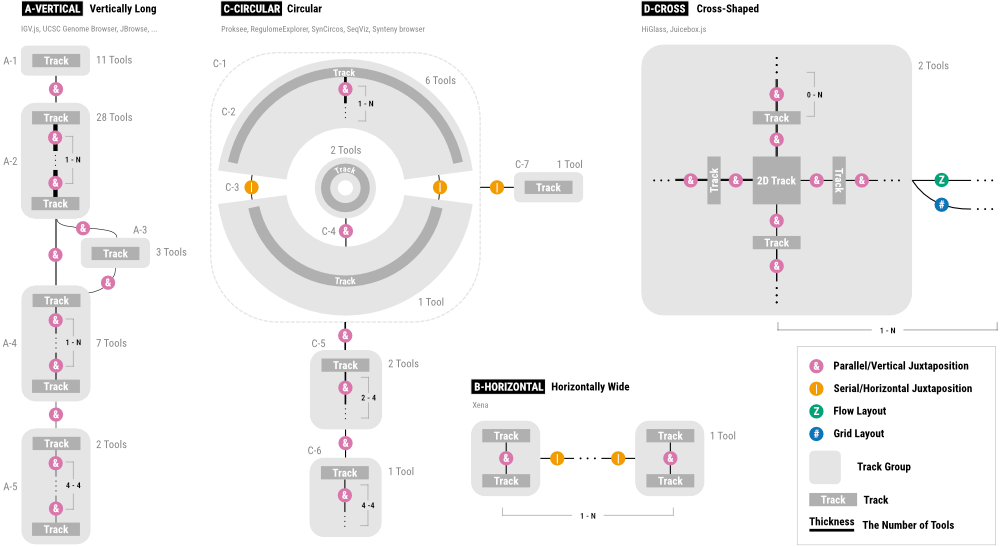
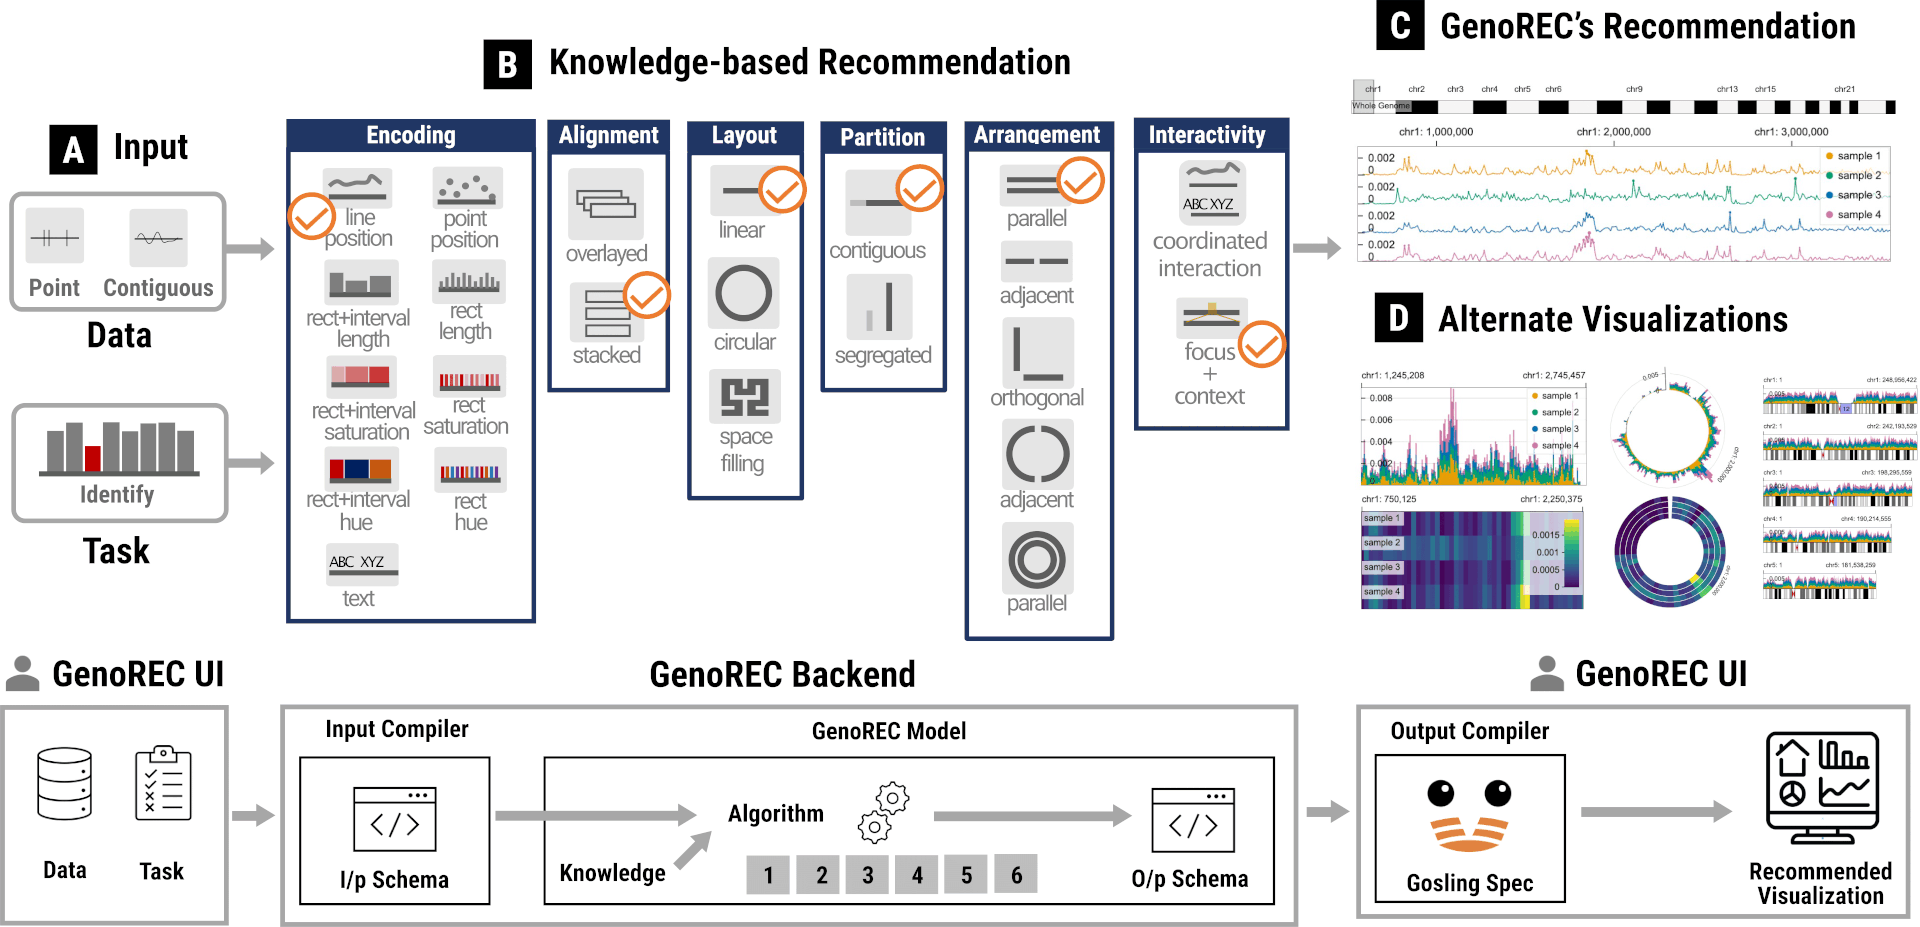
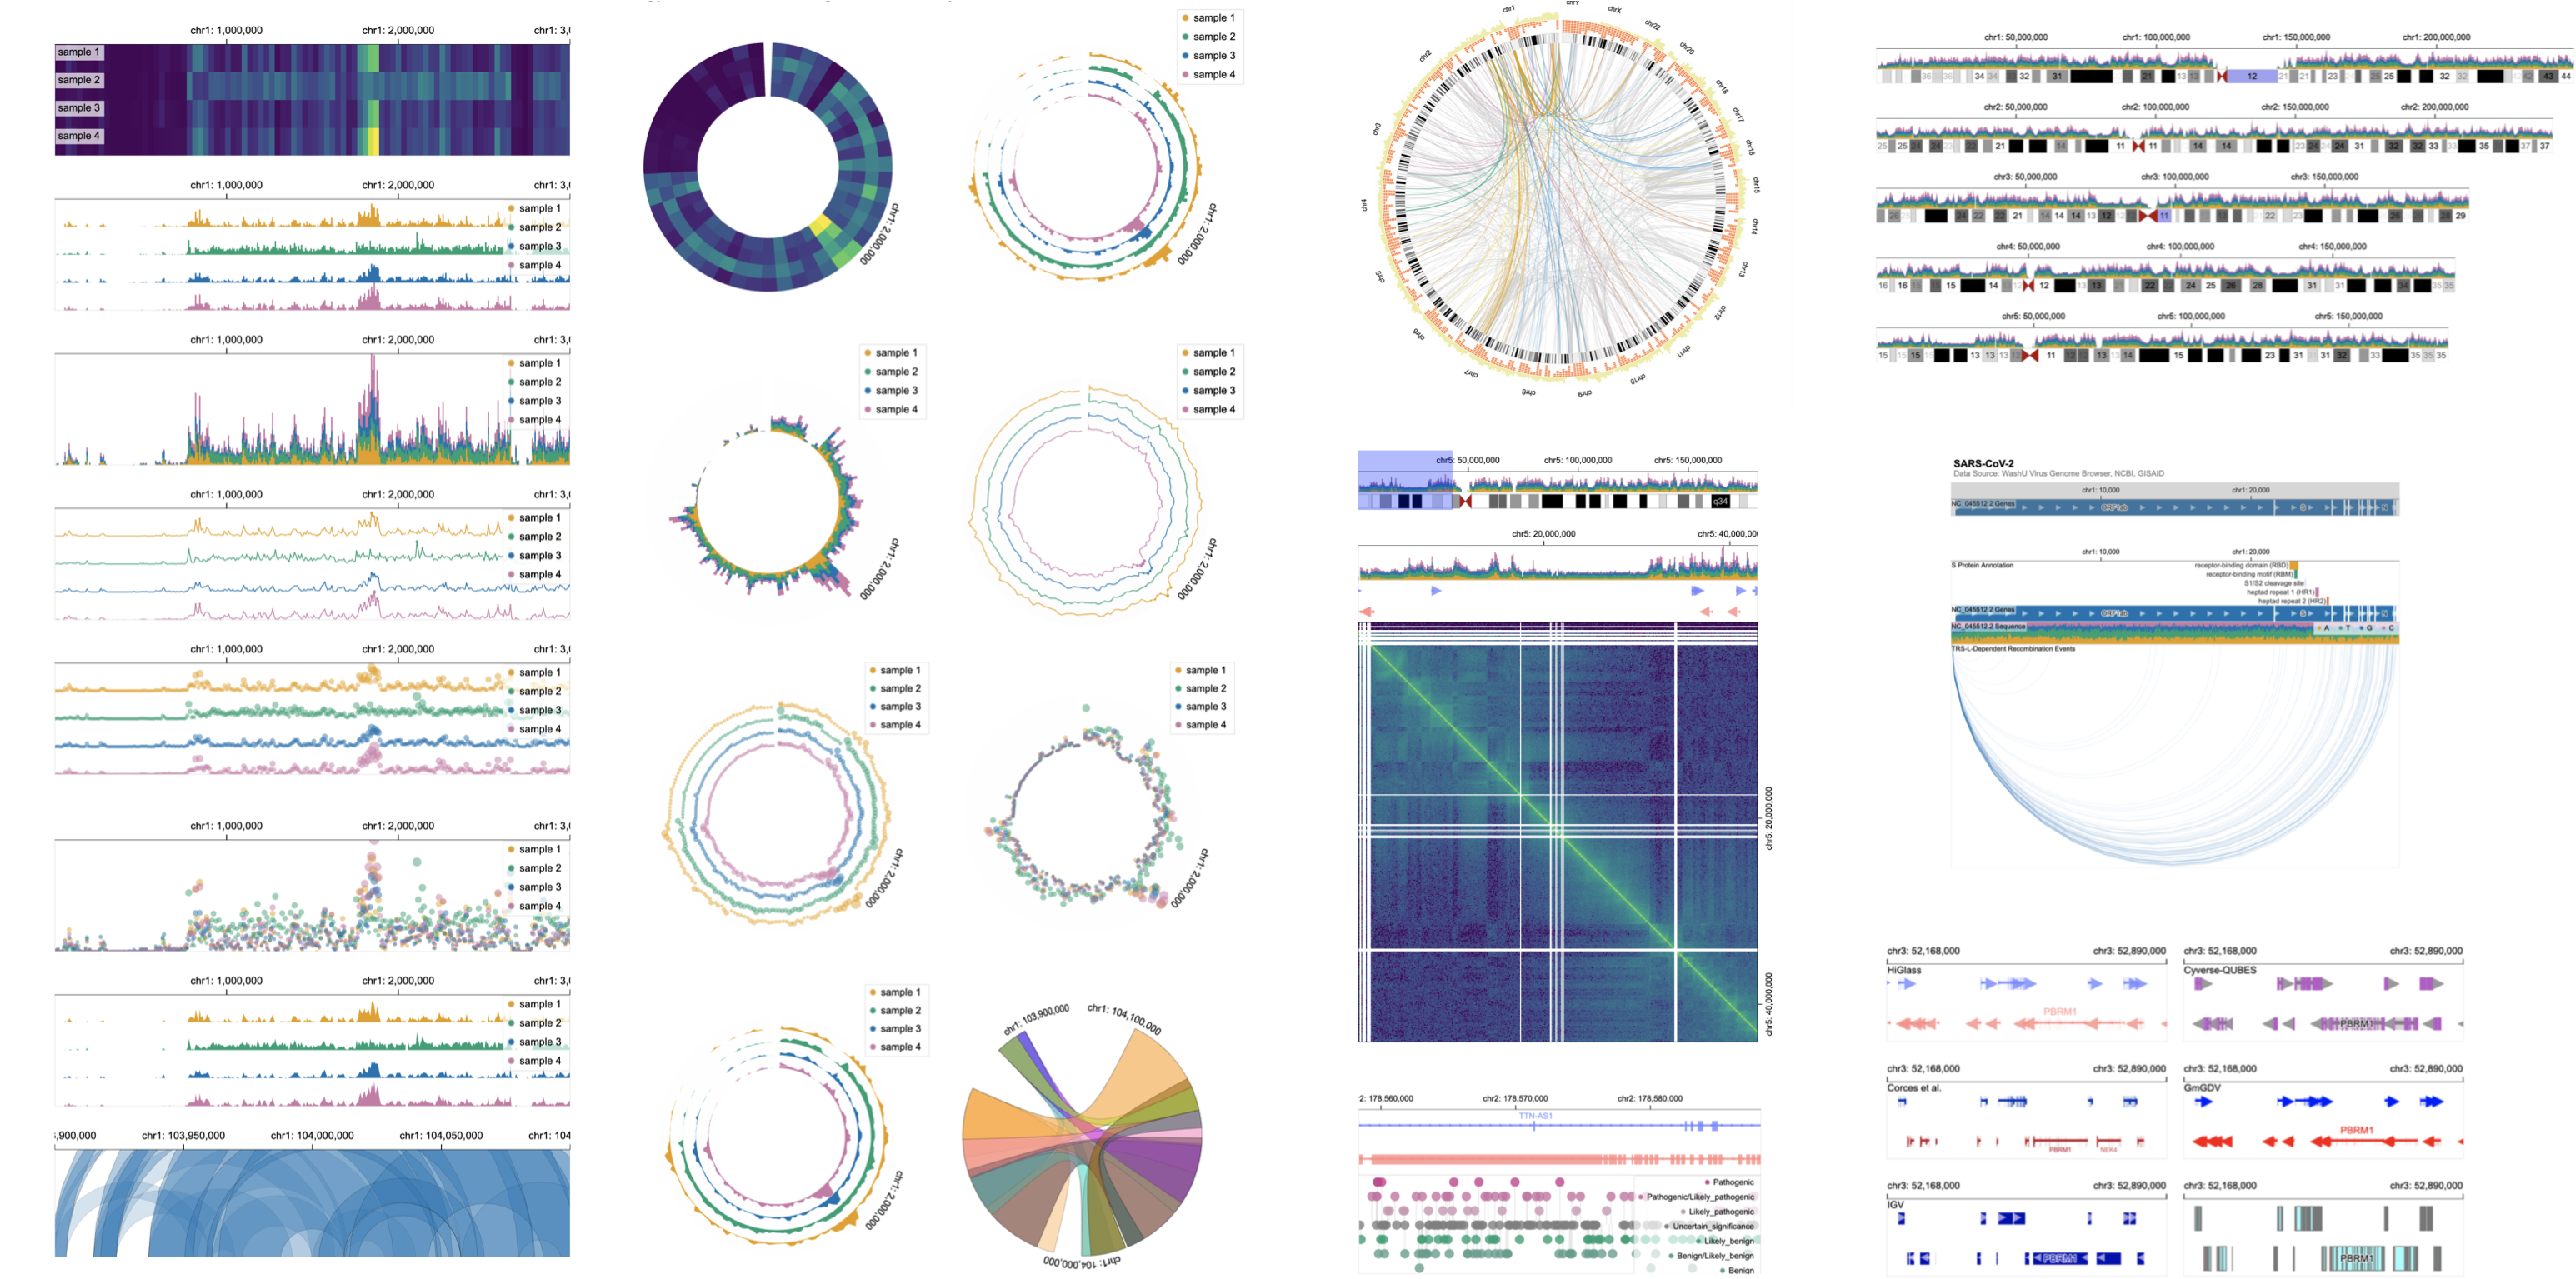
As an interdisciplinary researcher working at the intersection of data visualization, human–computer interaction, and biomedical informatics, my vision is to democratize the creation and use of domain-specific data visualizations. I design and develop interactive data systems that scale to a wide range of user needs within biomedical domains. For example, I built foundations for domain-specific visualization and AI through developing a domain-specific language (DSL), which enables constructing scalable and interactive genomics data visualization and leveraging AI methods (read Nature’s Technology Feature).
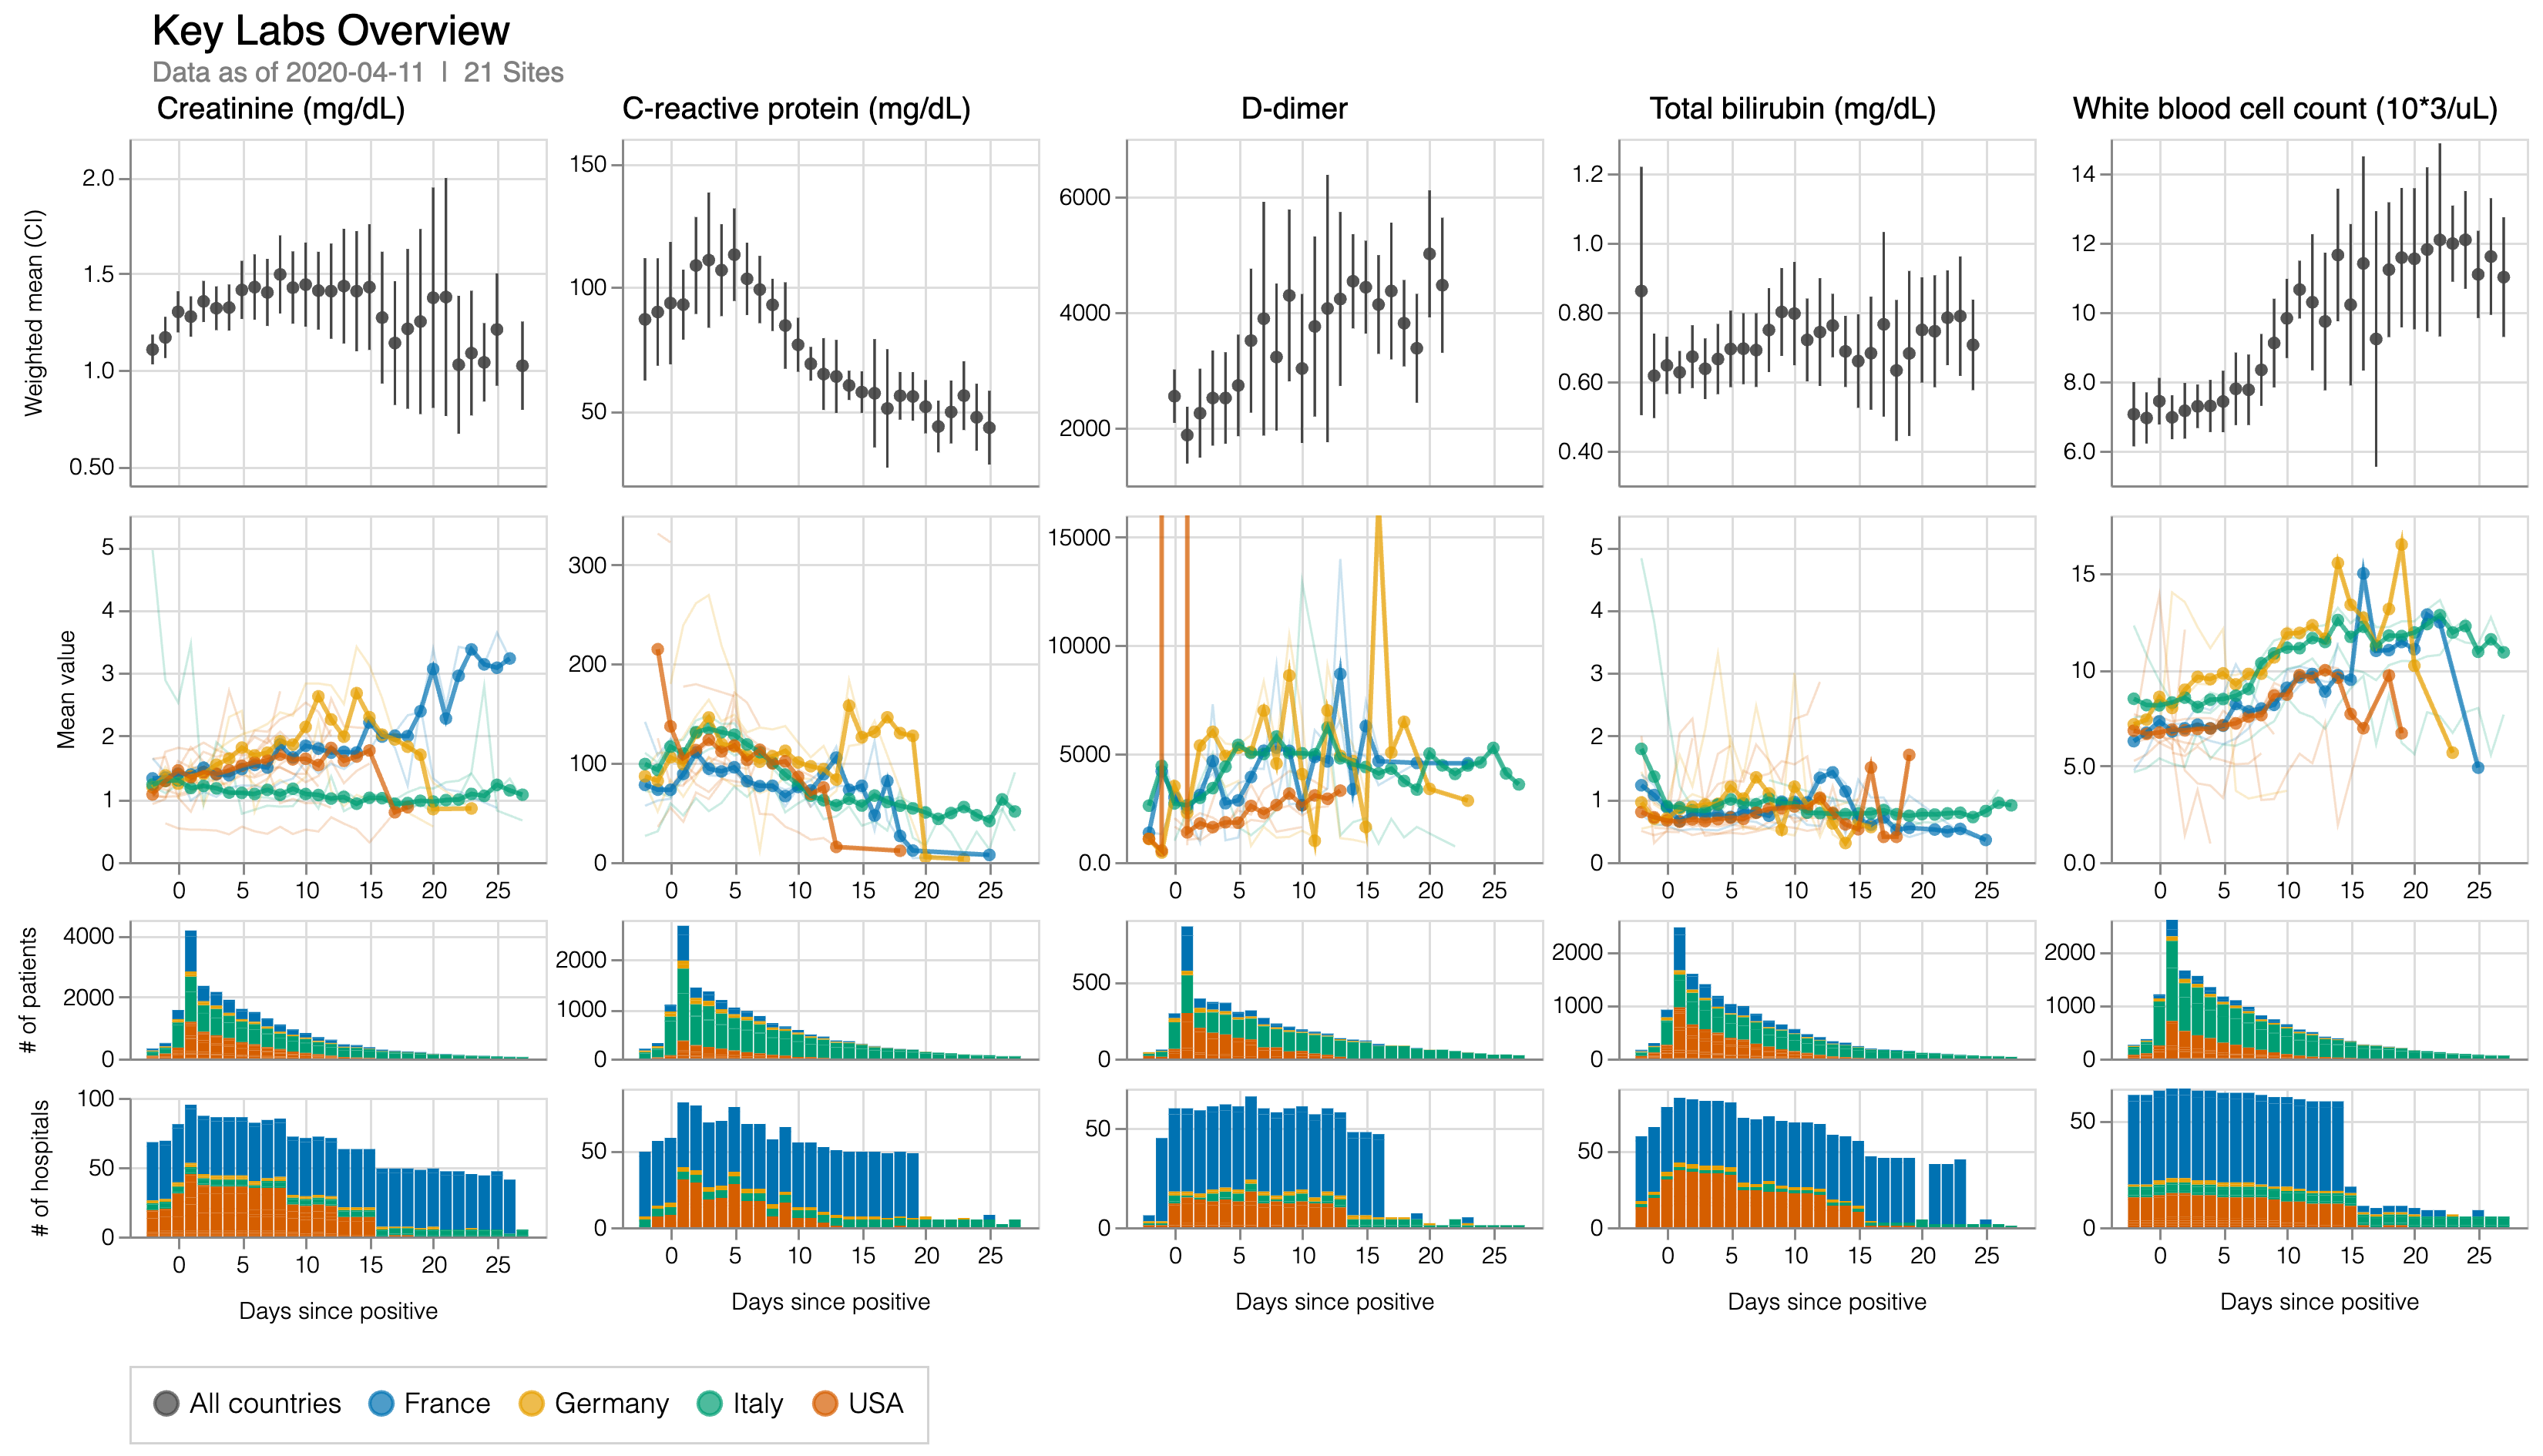
I have also been closely collaborating with diverse biomedical experts through my expertise in visualization and biomedical informatics. A collaborative project focused on analyzing and visualizing electronic health records (EHR) data of COVID-19 (4CE Consortium).
Research I led received several notable academic awards, including NIH/NHGRI K99/R00 Pathway to Independence Award—which will provide research funding at my future faculty institution ($747,000)—Best Paper Honorable Mention (Top 5%) at IEEE VIS 2024, and Best Abstract Award (Top 1) at ISMB BioVis 2021.
Latest News
| Jan 20, 2026 | I'm serving as Program Committee for full papers at VIS 2026 |
| Jan 16, 2026 | Our paper on Visualization Design Knowledge Bases conditionally accepted at CHI 2026 |
| Oct 27, 2025 | I'm serving as Program Committees for VisNotes at PacificVis 2026 and short papers at EuroVis 2026 |
| Oct 27, 2025 | My senior-author paper accepted at PLOS Computational Biology |
| Jul 28, 2025 | A full paper and a GenAI workshop paper accepted at VIS 2025 |
| Jul 27, 2025 | One paper received Runner-Up Abstract Award at ISMB BioVis 2025 |
| Jun 25, 2025 | Our papers accepted at Nature sister journals, Scientific Reports and EMM |
| Mar 01, 2025 | I'm serving as Program Committees for full papers at VIS 2025 and VisNotes at PacificVis 2025 |
| Jan 24, 2025 | Our workshop has been accepted at ISMB 2025 |
| Oct 31, 2024 | One paper accepted at Oxford Bioinformatics |
| Oct 28, 2024 | Chromoscope integrated into cBioPortal - most widely used data portals for cancer genomics |
| Sep 01, 2024 | I'm deeply honored to receive NIH K99/R00 Pathway to Independence Award |
| Aug 11, 2024 | Our paper received Best Paper Honorable Mention at VIS 2024! |
Media Coverage
 Nature (TECHNOLOGY FEATURE)
Powerful 'grammar' allows geneticists to display their data in interactive and scalable illustrations.
"Postdoc Sehi L’Yi, who led Gosling’s development, says that what differentiates Gosling from other visualization tools is its expressiveness. With most tools, he says, the graphics that can be made and what they will look like are predefined. ‘It is really not easy to customize visualizations as a user.’ But with Gosling, users can, for instance, specify the colour, dimensions and placement of the symbol used to represent a centromere or genomic interval, then overlay that on an ideogram of a chromosome to highlight a region of interest."
|
|

